When single stocks outgrow nations
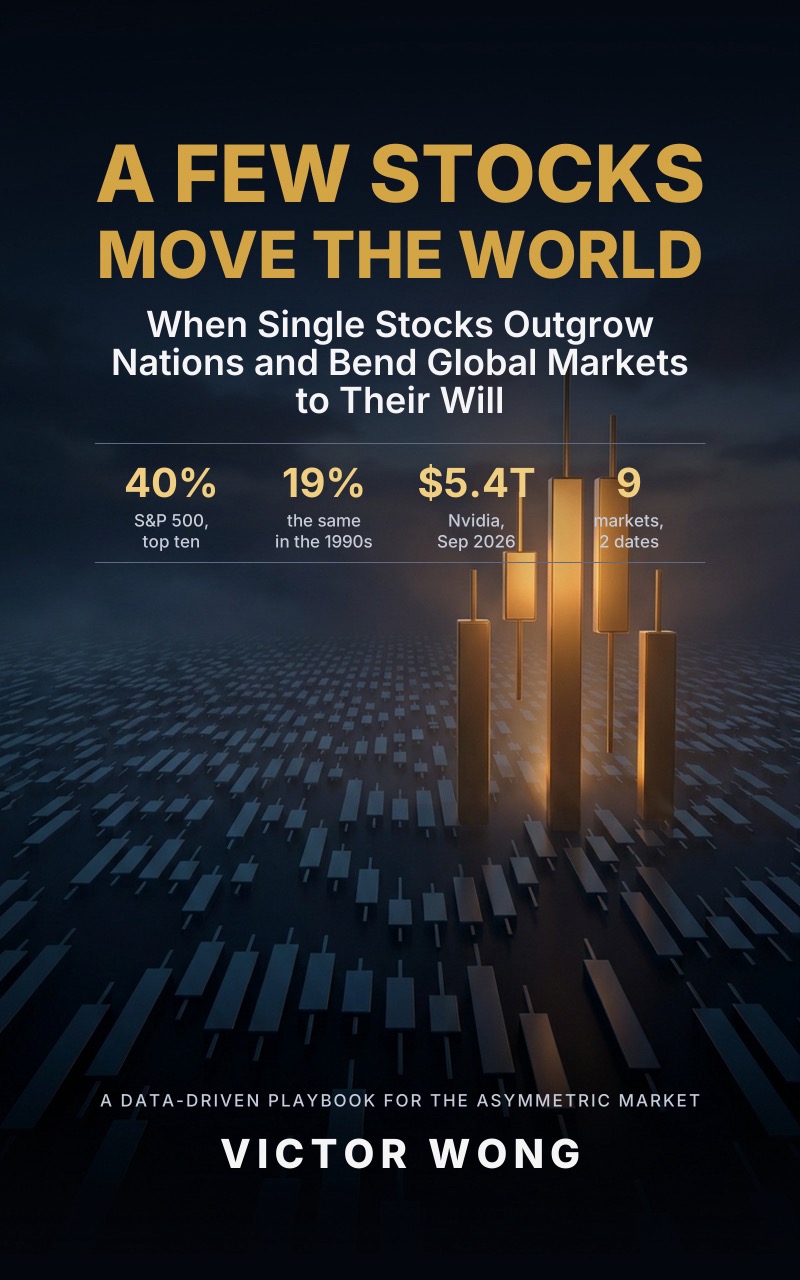
Forty per cent of the S&P 500 now sits in ten stocks. Four companies sit at the centre of the AI supply chain — and there is no second supplier to call.
What each chapter argues, in order, with the figures it uses. From chapter 1 to the last page.
PART I — THE WORLD AS IT IS
Chapter 1 argues that the artificial-intelligence boom is an industrial transformation rather than a software one, and that its profits have concentrated in a small number of physical suppliers. It opens with Nvidia's revenue rising from $27.0 billion to $60.9 billion to $130.5 billion across two fiscal years, then profiles five companies: Nvidia, SK hynix, Samsung, TSMC and Broadcom. SK hynix earned an operating profit of ₩47.2 trillion in 2025, while Samsung's operating profit went ₩6.57 trillion to ₩32.7 trillion to ₩43.6 trillion. TSMC made more than 72% of outsourced semiconductor production, and Broadcom's AI revenue grew 220% in fiscal 2024. The chapter then asks who can displace each leader: Nvidia holds about 81% of AI data-centre chips (IDC, 2026); TSMC and Samsung Foundry are 66.6 percentage points apart; Broadcom's AI revenue heads toward about $56 billion in fiscal 2026 from $20 billion. Only high-bandwidth memory visibly broke, with SK hynix falling 64% → 58% → 50% as Samsung rose 15% → 21% → 33%. The takeaway is that AI is capital-intensive, so profits and index weight concentrate, and the shortage moves to whichever layer is scarcest.
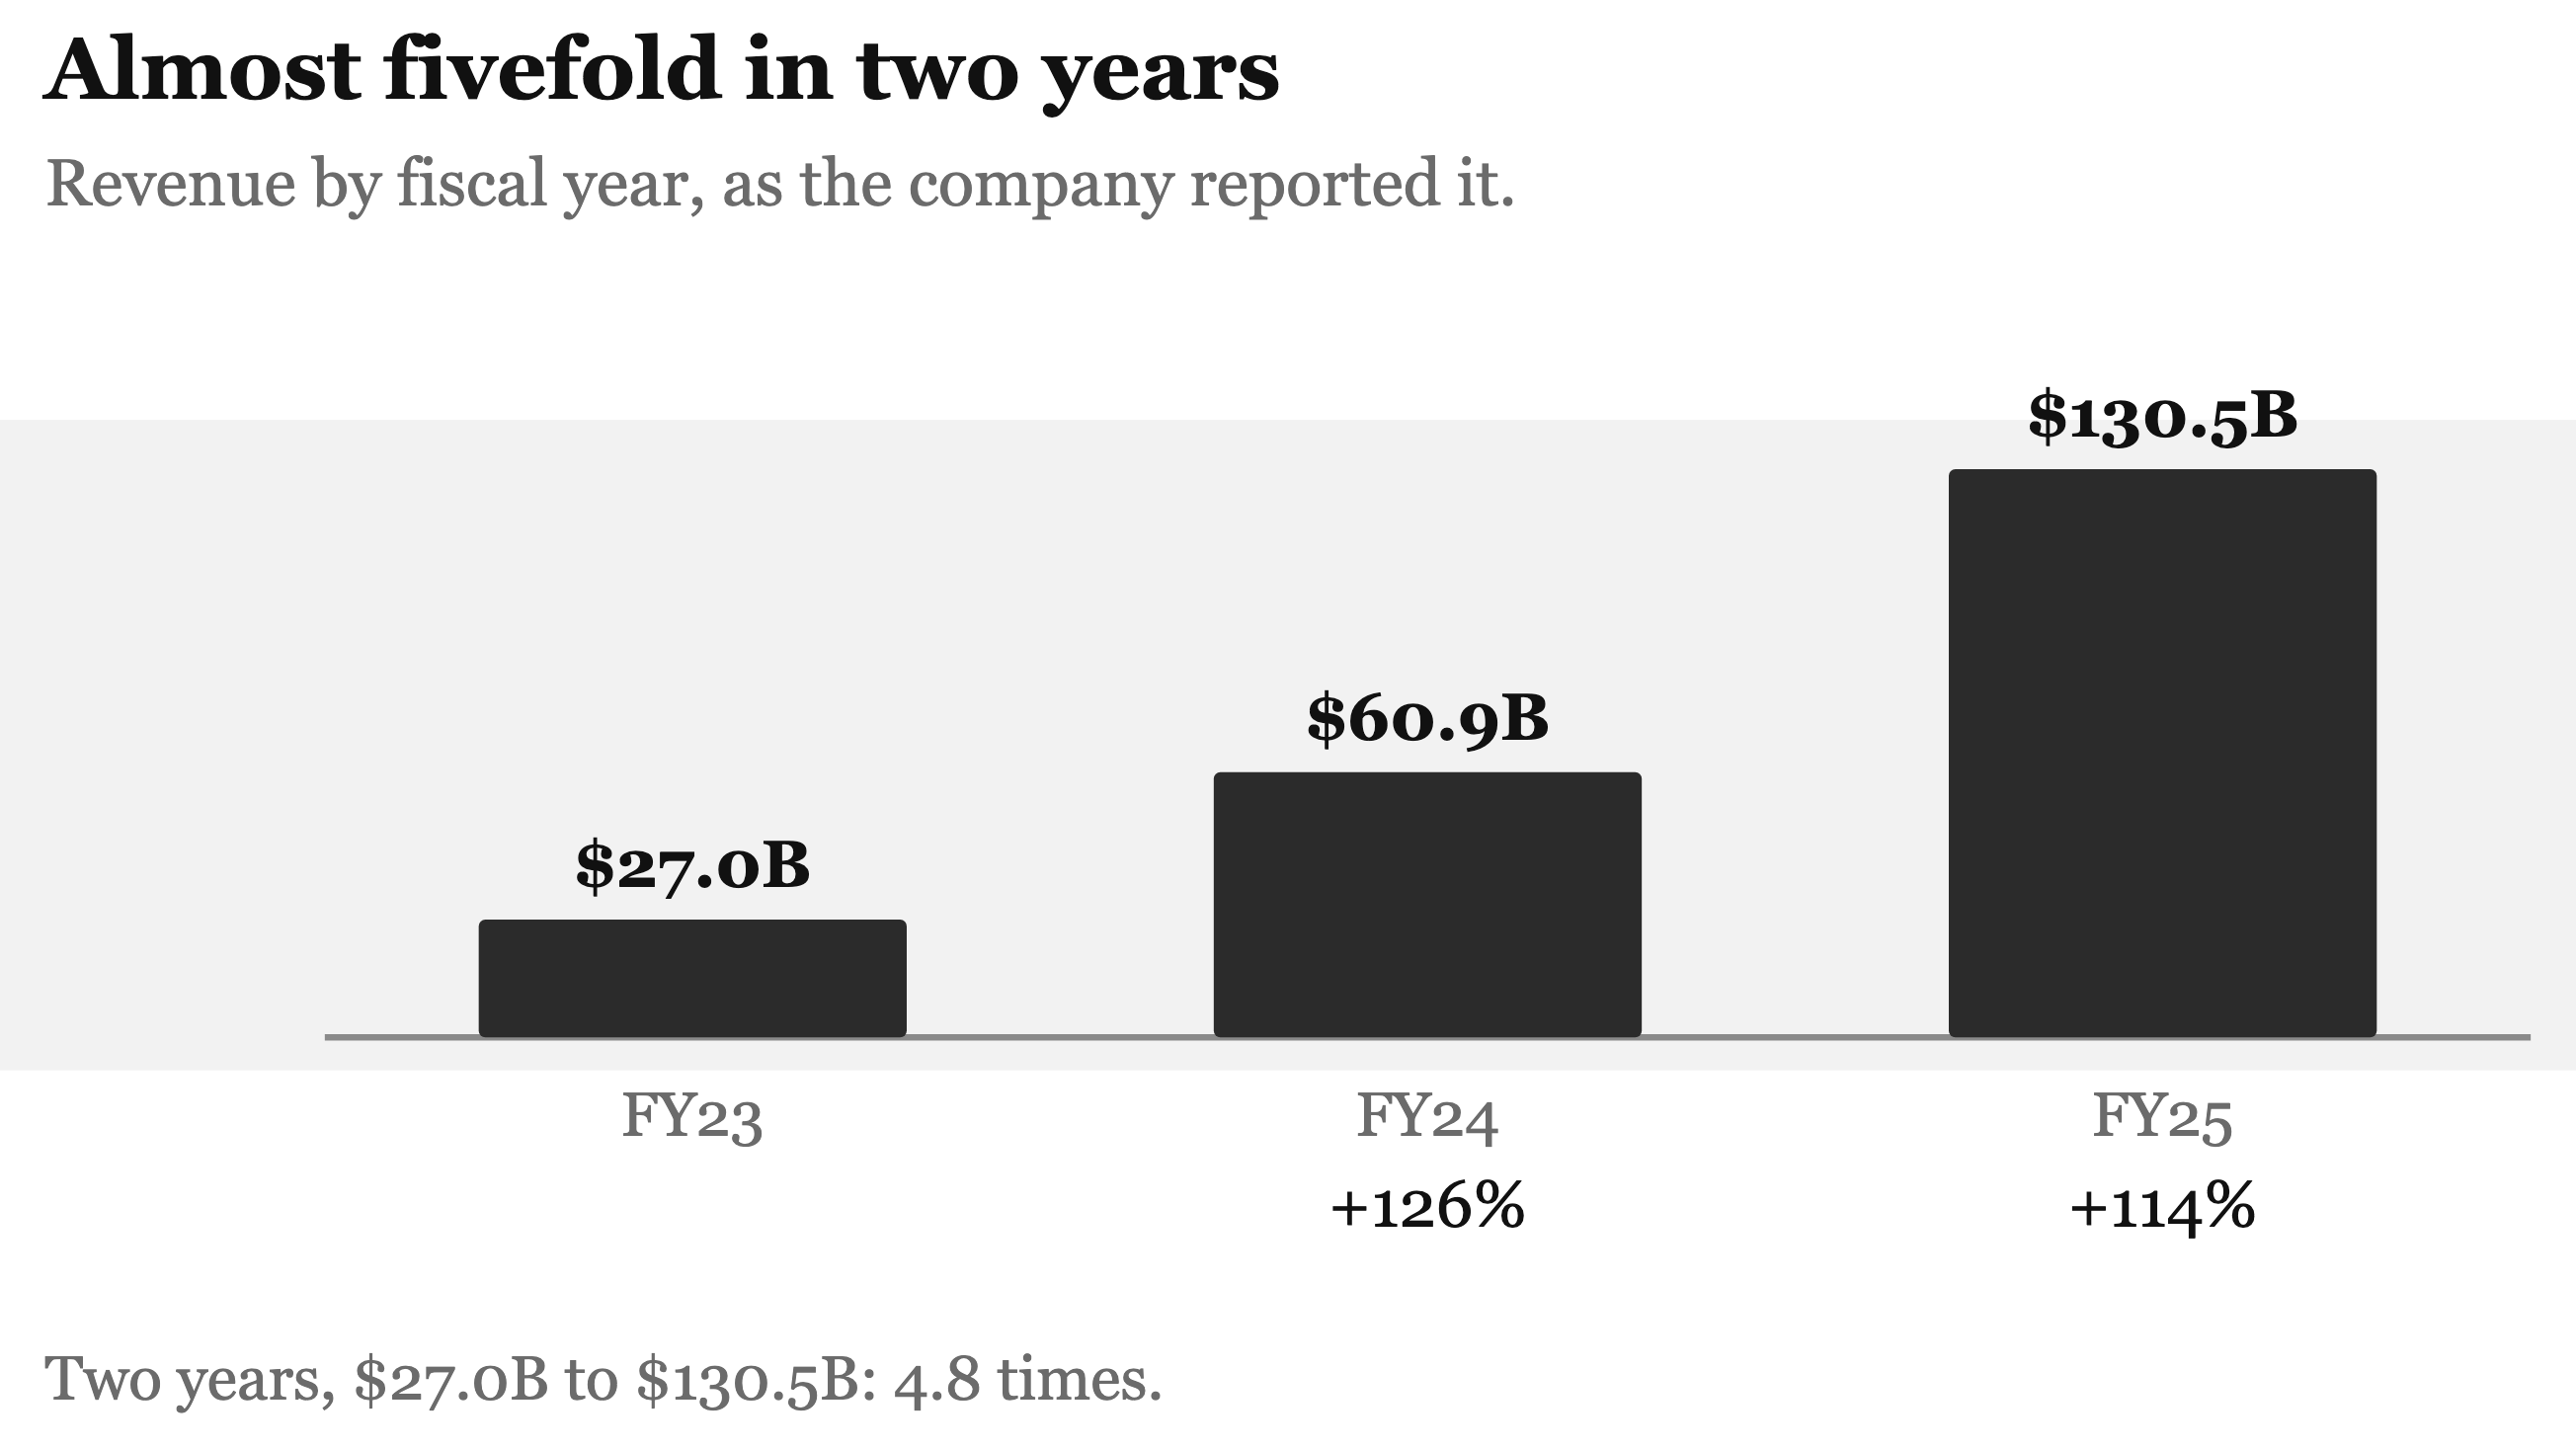
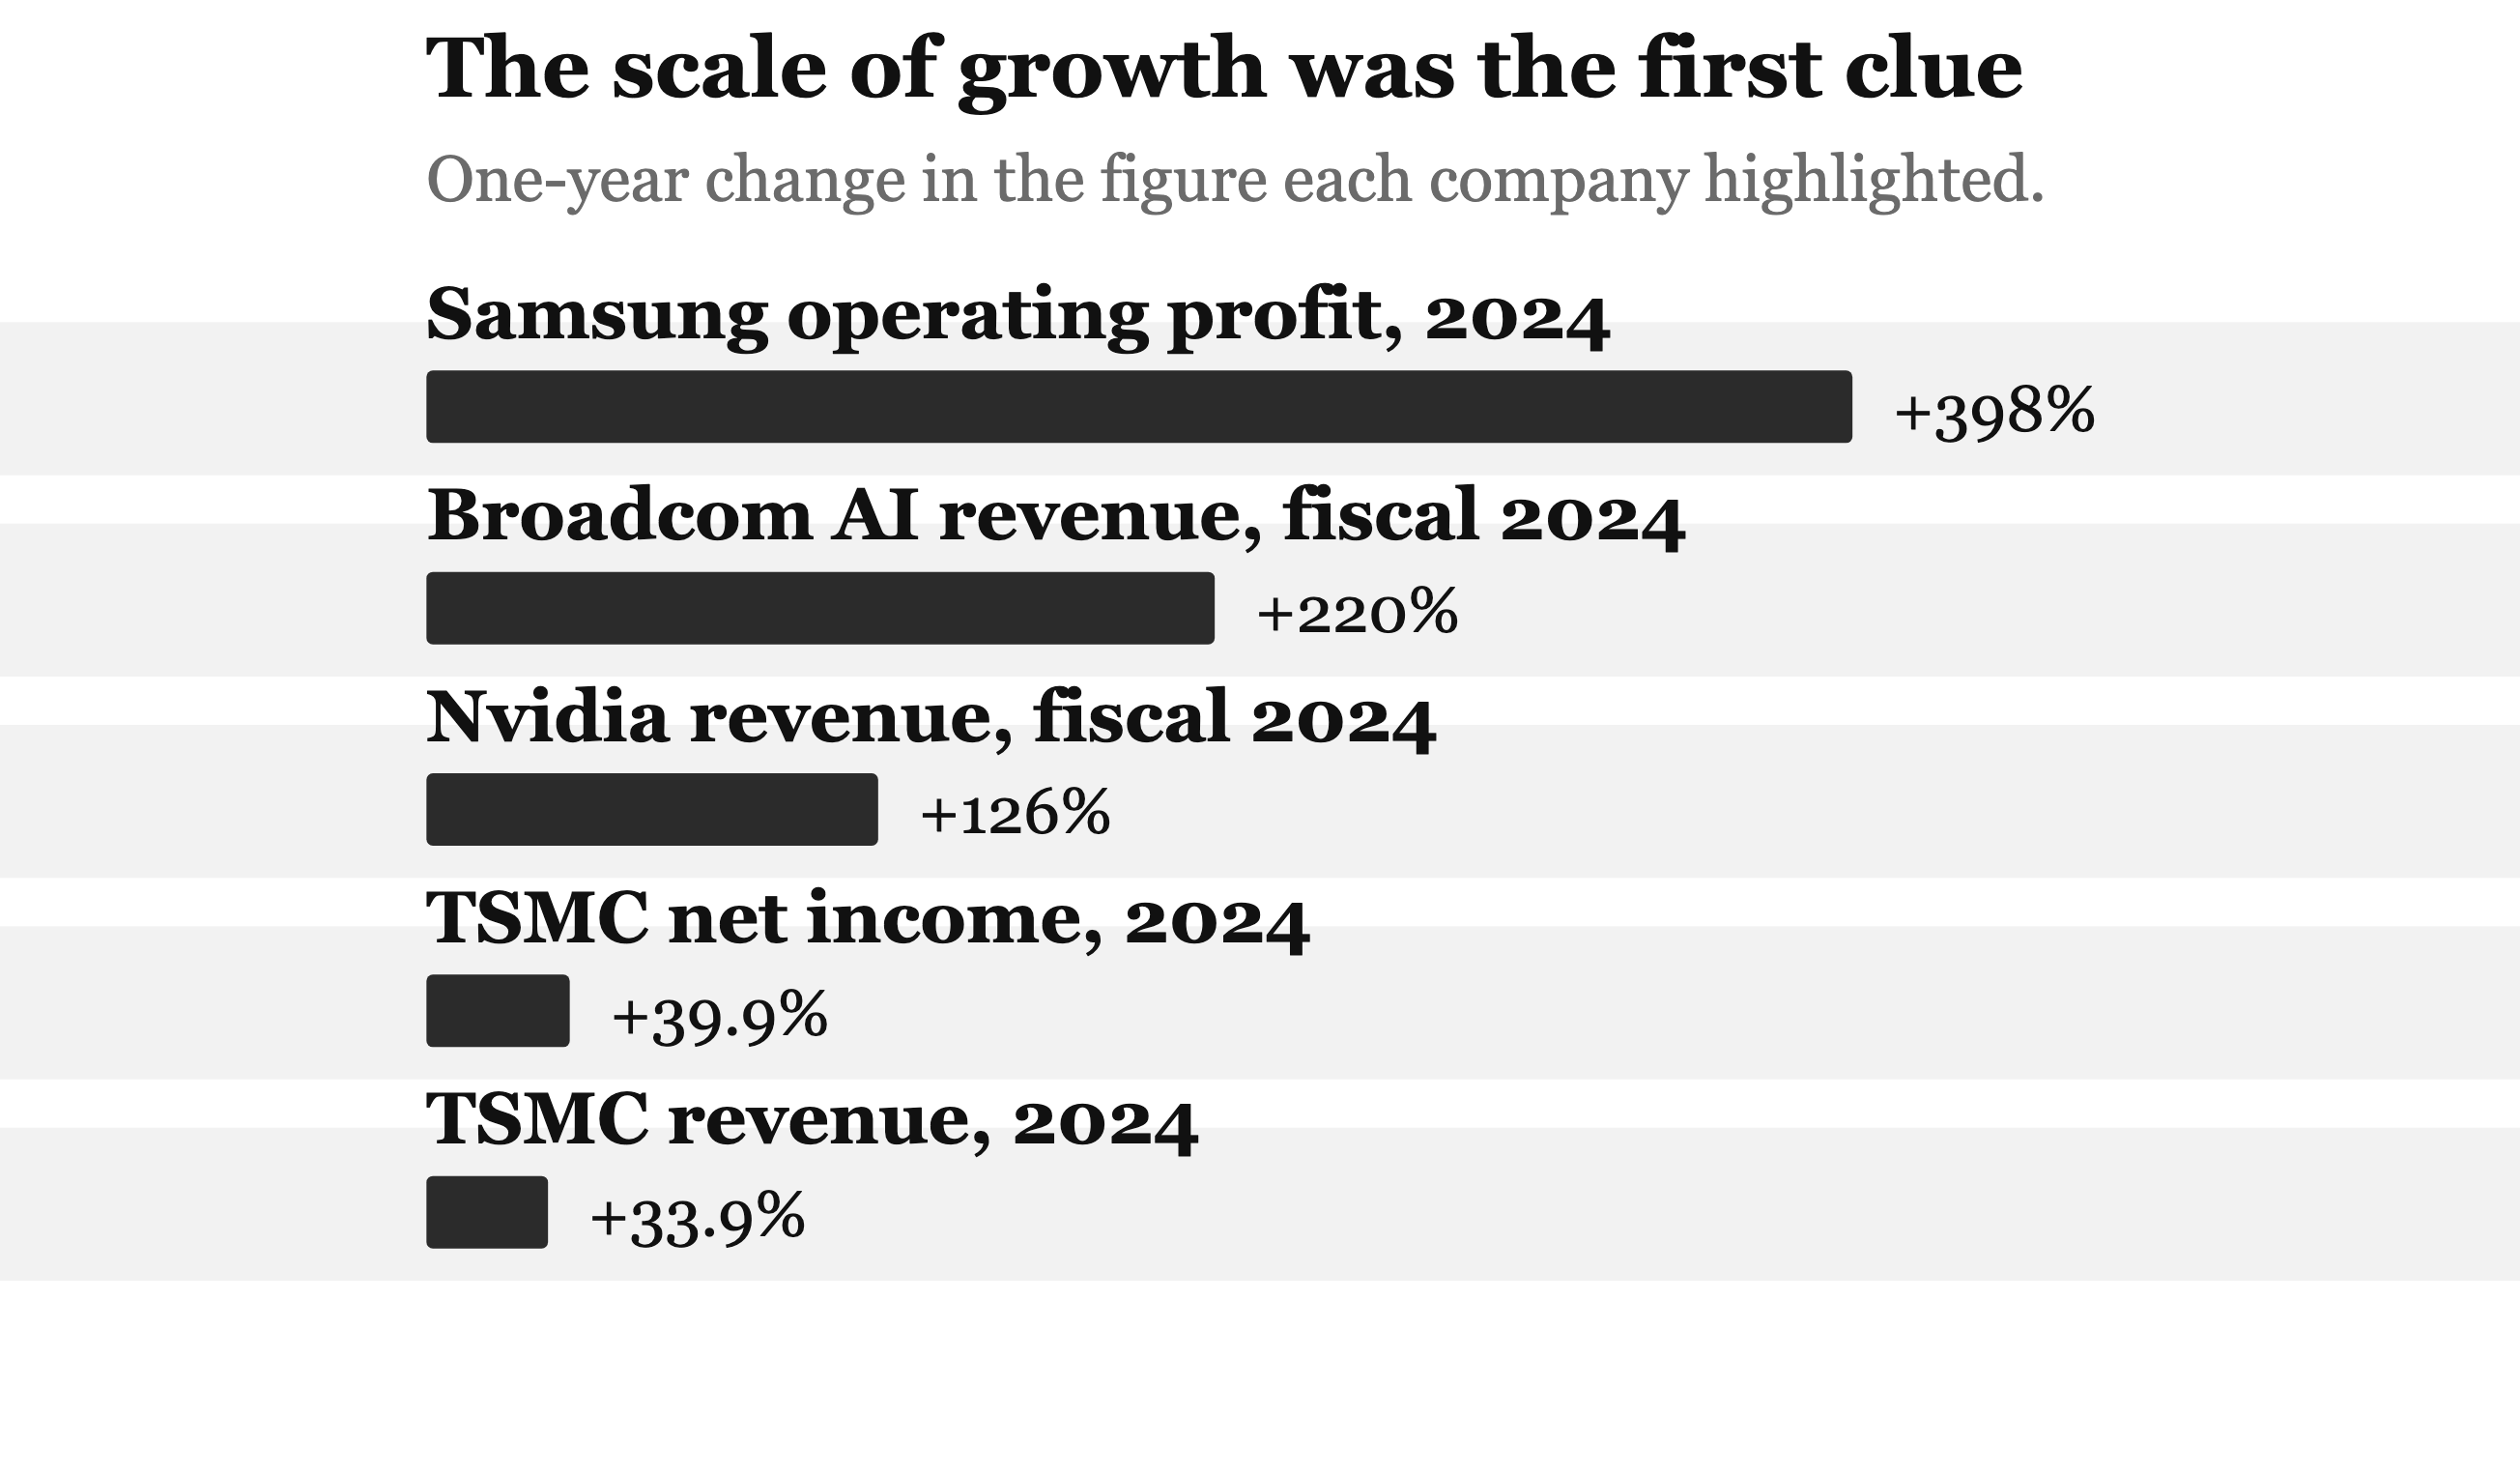
Table 1-1.
| Company | The figure | Why it mattered |
|---|---|---|
| Nvidia | Revenue rose from $27.0B in fiscal 2023 to $60.9B in fiscal 2024, then $130.5B in fiscal 2025. | AI computing demand was becoming visible in company-sized leaps. |
| SK hynix | 2023 revenue ₩32.77T with an operating loss of ₩7.73T; 2024 revenue ₩66.2T, operating profit ₩23.5T; 2025 revenue ₩97.15T, operating profit ₩47.2063T — a 49% operating margin. | Advanced AI memory was a strategic bottleneck. |
| Samsung Electronics | Operating profit climbed from ₩6.57T in 2023 to ₩32.7T in 2024—nearly five times higher—then ₩43.6T in 2025 on revenue of ₩333.6T. | The memory recovery could alter the earnings power of a giant in a single year, and then keep going. |
| TSMC | 2024 revenue rose 33.9% and net income rose 39.9%. | The factories at the heart of advanced chips captured more of the AI build-out. |
| Broadcom | Fiscal-2024 AI revenue grew 220% year over year. | The boom extended beyond processors into the networks that connect AI systems. |
Table 1-2.
| Layer | The leader | The challengers | How close they are |
|---|---|---|---|
| Compute | Nvidia, about 81% of AI data-centre chips (IDC, 2026) | AMD, Intel, and the customers' own chips | AMD's data-centre revenue was $5.8bn in the March 2026 quarter, up 57% — real, and still a fraction of Nvidia's $75.2bn in the same quarter. The faster-growing threat is not AMD at all: custom chips grew 44.6% in 2026 against 16.1% for ordinary GPUs |
| High-bandwidth memory | SK hynix, 64% → 58% → 50% in three quarters | Samsung 15% → 21% → 33%, Micron, CXMT | The gap narrowed from 49 points to 17 in a year — the clearest case of a chokepoint being broken |
| Memory and manufacturing | Samsung | SK hynix, Micron, Kioxia, CXMT | Samsung leads on size and lost the profit race: SK hynix earned ₩47.2tn in 2025 on a third of the revenue |
| Leading-edge foundry | TSMC, 72.5% of the market (TrendForce, Q2 2026) | Samsung Foundry 5.9%, SMIC 5.4%, UMC, GlobalFoundries | The gap is widening, not closing: TSMC and Samsung were 66.6 points apart, up from 65.8 the quarter before. Intel does not appear in the top ten |
| Networking and custom chips | Broadcom, AI revenue heading for about $56bn in fiscal 2026 | Marvell, Nvidia's own networking, Cisco and Arista | Broadcom went from $20bn to a guided $56bn in one year — the fastest-growing position in the chain |
Chapter 2 compares the world's stock markets in 2020 and 2026, starting with six markets and the dates beneath every figure. In the United States the Magnificent Seven were about 27% of the S&P 500 at the end of 2020 and worth about $8.5 trillion; by September 2026 they were about 33.5% and $23.8 trillion, and in 2025 they produced more than 40% of the index's total return. Korea is the extreme case: Samsung Electronics and SK hynix were 31.2% of the KOSPI in March 2020, 50.7% in May 2026, 55.7% in June, peaking at 58.9% before a −40% index drawdown in July. TSMC went from 30.6% of the TWSE to 41.4% in August 2026, and earned 72.5% of global foundry revenue. Japan kept Toyota first while Kioxia rose to fourth and Advantest ninth. Thailand's DELTA reached THB 3.44 trillion, the first Thai company past $100 billion. China's Alibaba fell from about $625 billion to $275 billion as CXMT passed ICBC in July 2026. The chapter shows the reader's own index is no longer a broad bet on an economy, but on a handful of companies sharing one buildout.
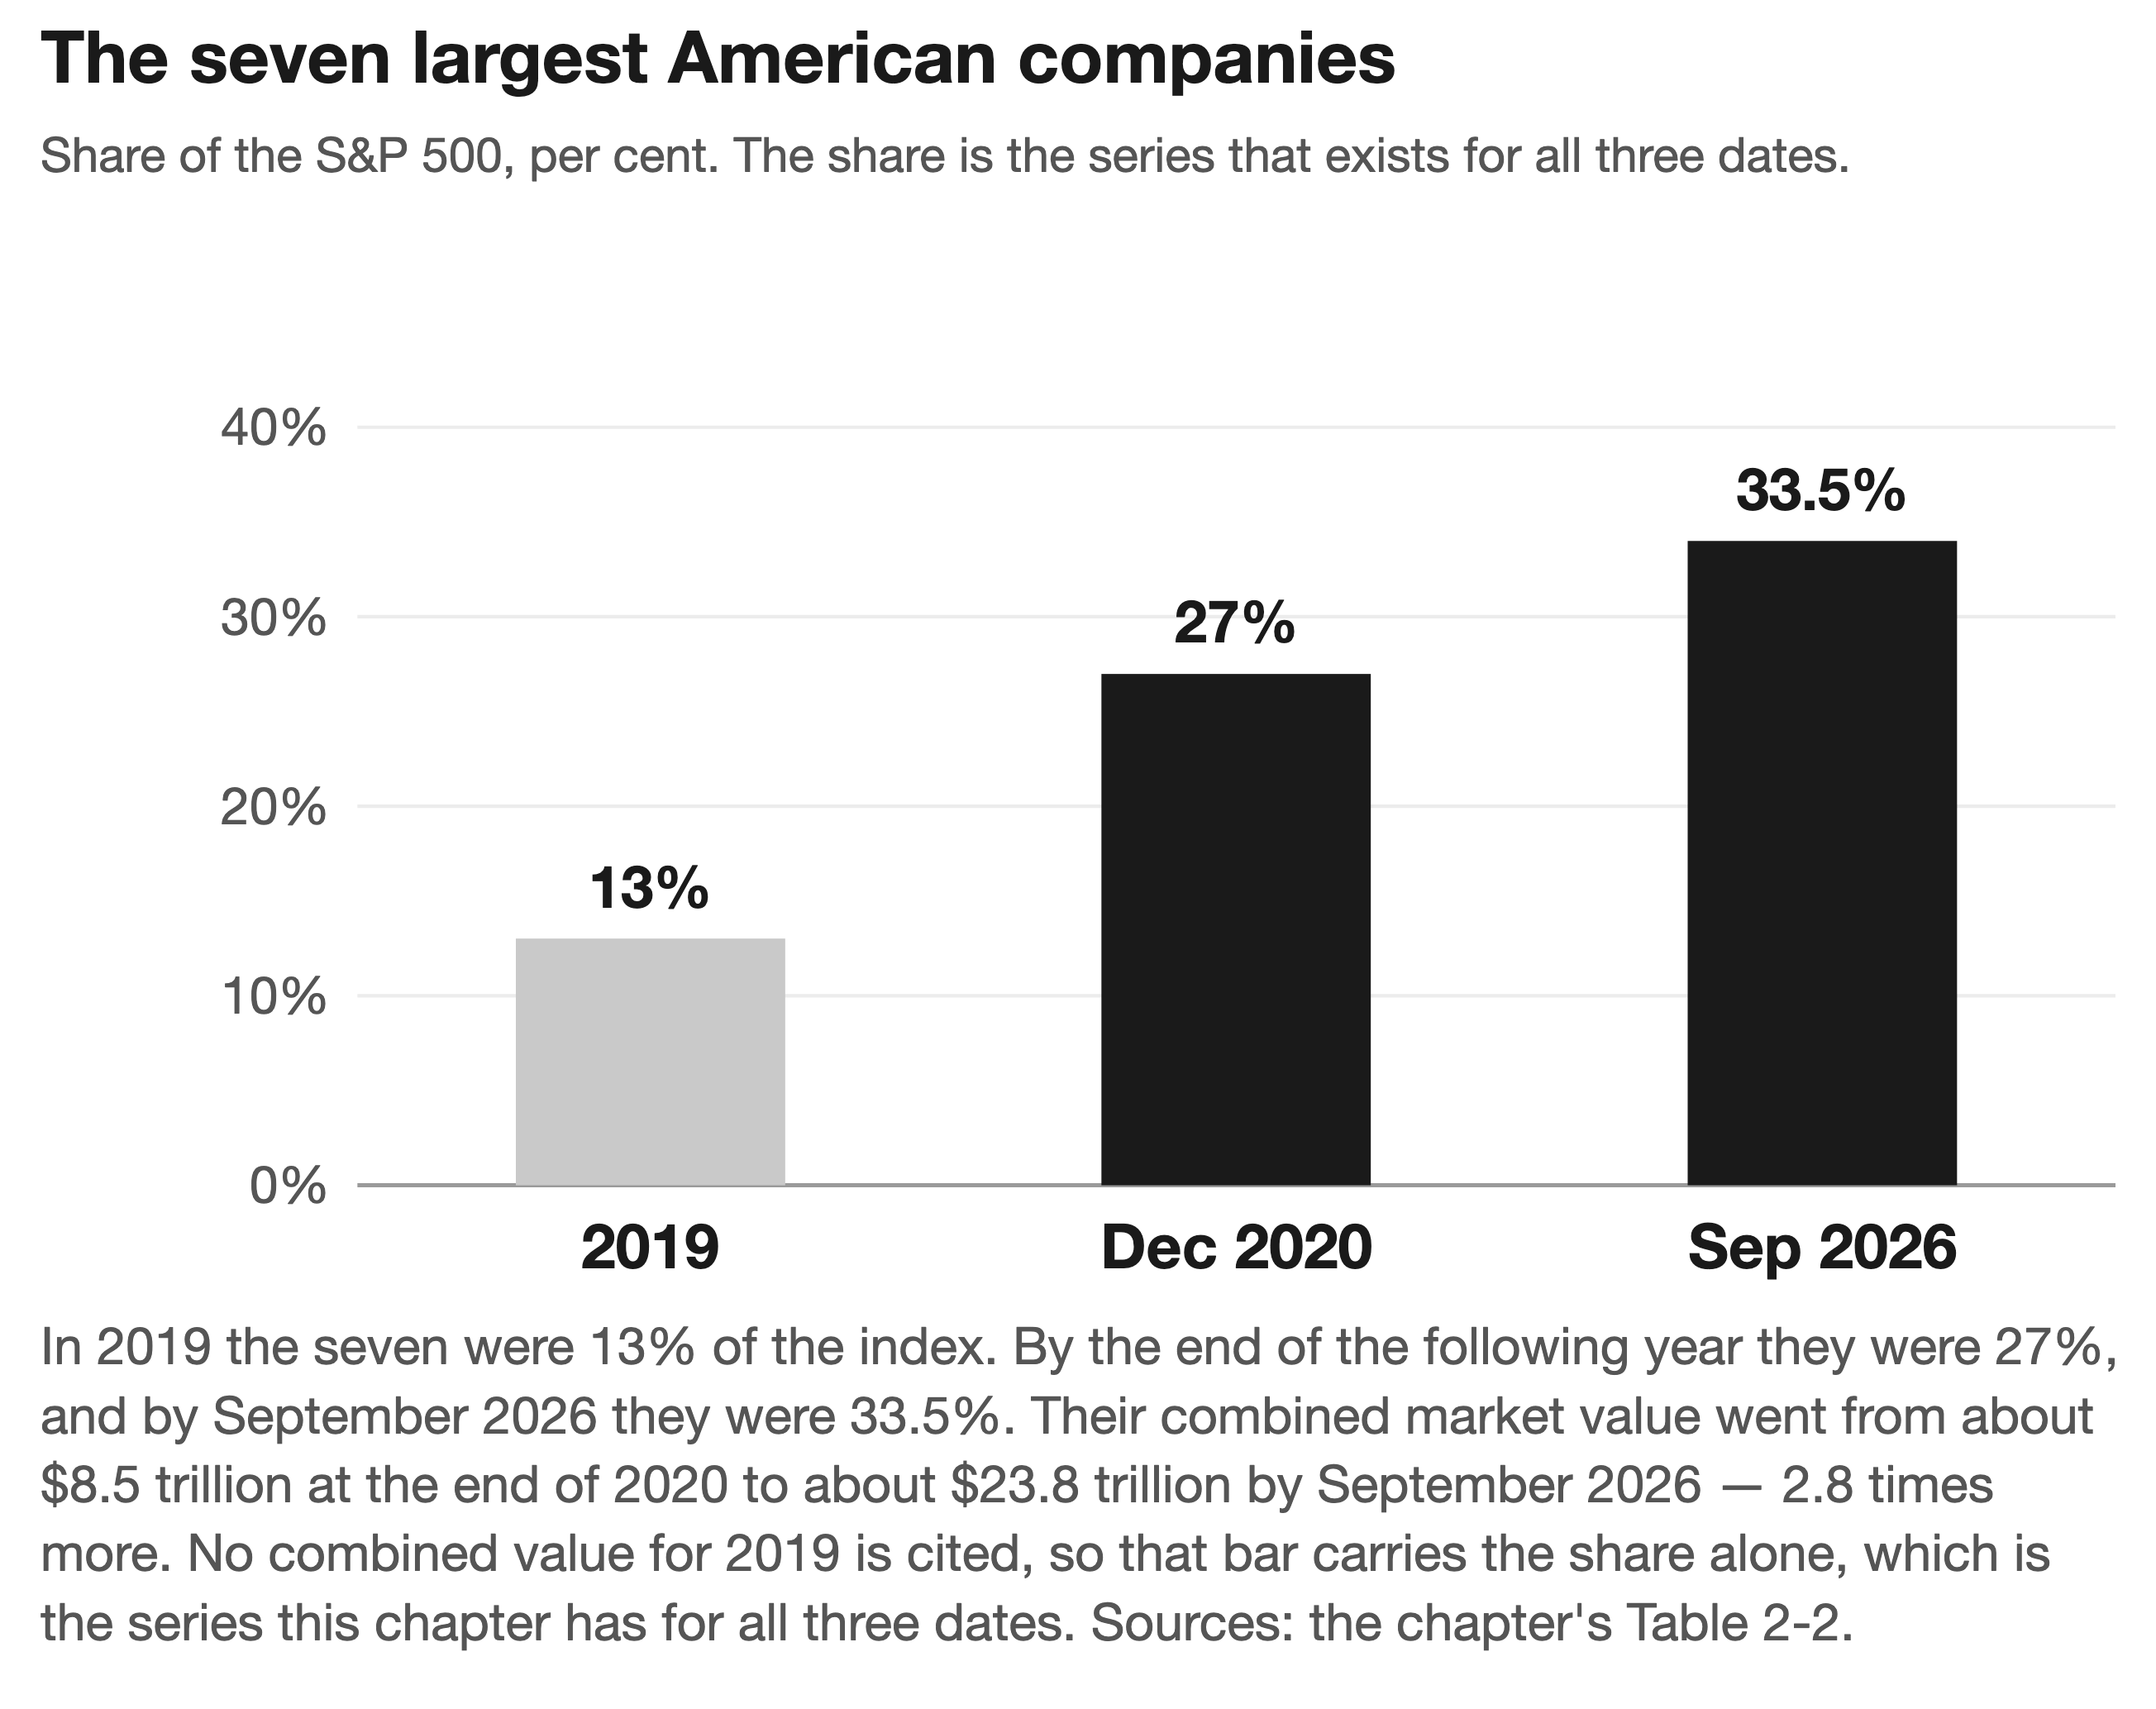
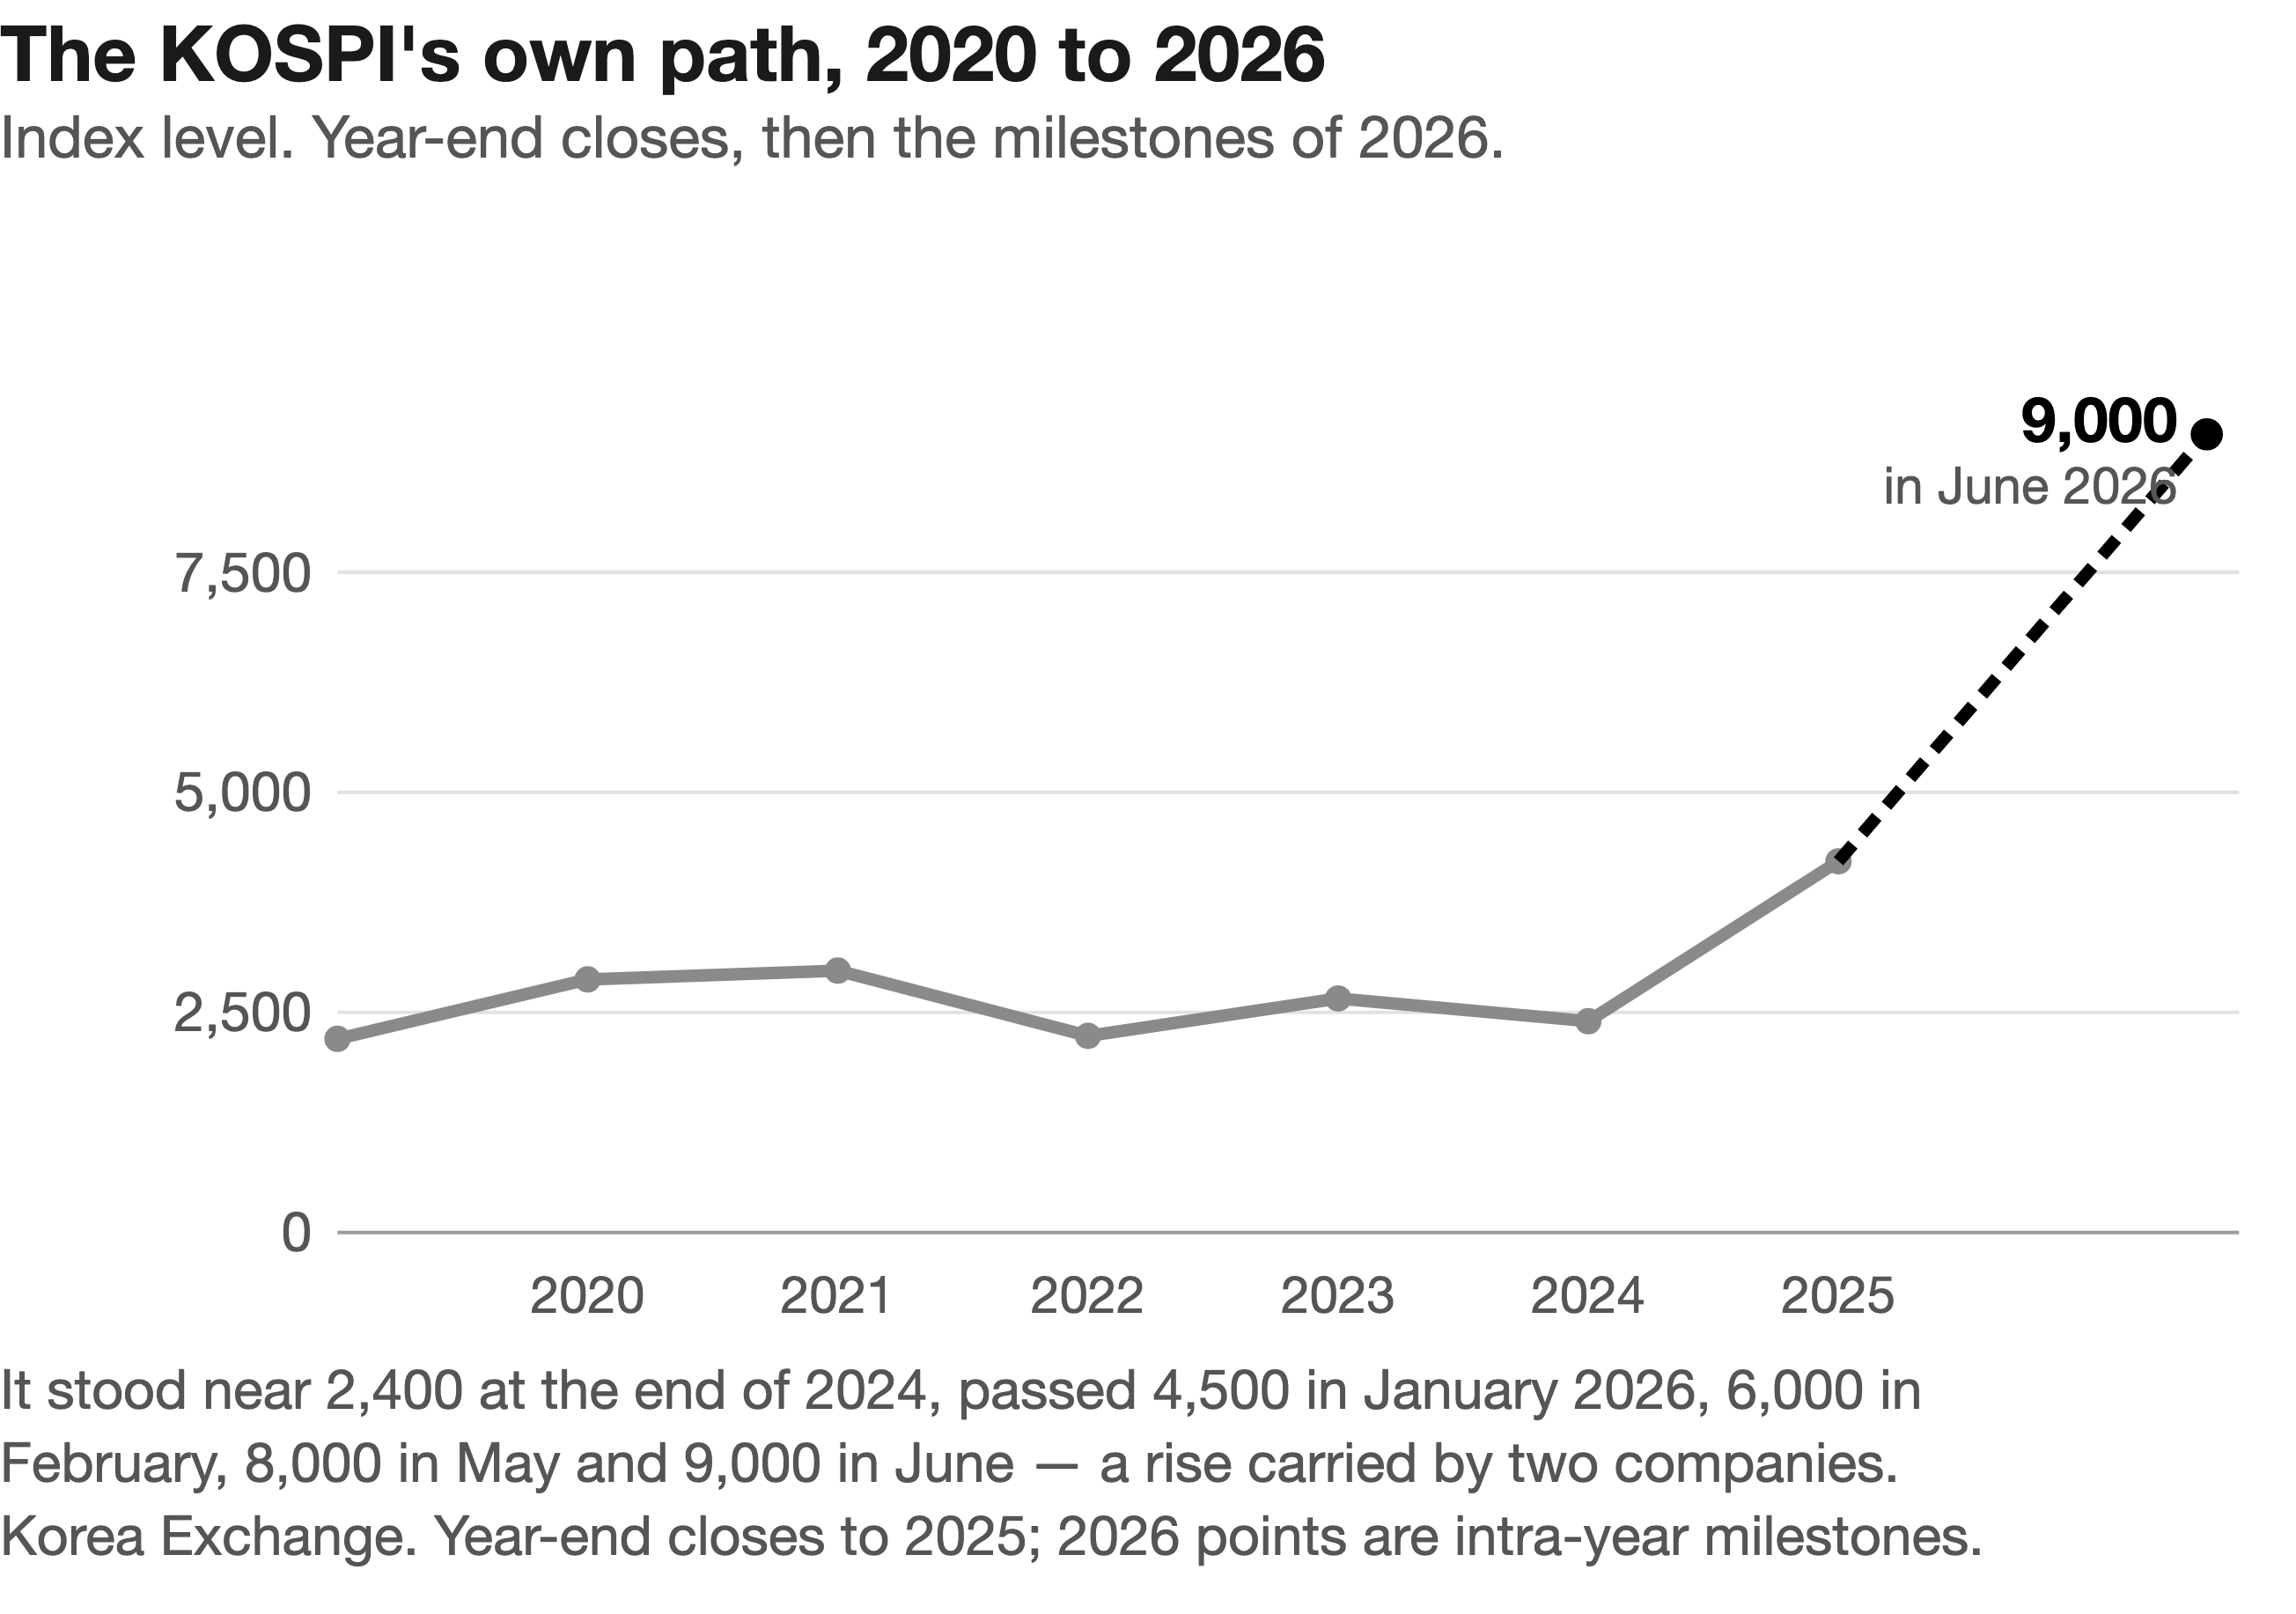
Table 2-2.
| Year | United States — top seven, share of the S&P 500 | Taiwan — TSMC, share of the TWSE | Korea — Samsung and SK hynix, share of the KOSPI |
|---|---|---|---|
| 2016 | — | 16.3% | — |
| 2019 | 13% | 22.7% | Samsung alone 27.5% (December) |
| 2020 | 27% (December) | 30.6% (December) | 31.2% (19 March) |
| 2021 | — | 28.9% | — |
| 2022 | fell with the market; the AI trade had not started | — | — |
| 2023 | surpassed 30% | — | — |
| 2024 | — | 37% (December) | — |
| 2025 | — | 38.3% | 27.1% (October), about 35% (December) |
| 2026 | about 33.5% (September) | 41.4% (August) | 50.7% (May) · 55.7% (June) · 58.9% peak · 51.5% (after) |
Table 2-1.
| Market | 31 December 2020 | September 2026 |
|---|---|---|
| United States | The Magnificent Seven were about 27% of the S&P 500 by weight, and worth about $8.5 trillion together | About 33.5% of the index and $23.8 trillion; more than 40% of the S&P 500's total return in 2025 |
| Korea | Samsung Electronics and SK hynix were 31.2% of the KOSPI (March 2020) | 50.7% of the KOSPI in May, 55.7% in June, peaking at 58.9% — then a −40% index drawdown in July |
| Taiwan | TSMC was worth about $488 billion and was 30.6% of the TWSE | TSMC worth $2.16 trillion, more than 42% of Taiwan's index, and 72.5% of global foundry revenue |
| Japan | Toyota was the largest company in the country | Toyota still is — but Kioxia is now #4 and Advantest #9 |
| Thailand | DELTA was one of the ten best-performing stocks on the SET, up 808% on the year | DELTA worth THB 3.44 trillion — the first Thai company past $100 billion, roughly 3× PTT |
| China | Alibaba was the champion, worth about $625 billion | Alibaba about $275 billion; a memory maker, CXMT, took the crown in July 2026 |
Chapter 3 is the book's control group: markets where nothing changed, and why. Its test is whether a country's market contains a layer of the AI supply chain. Europe complicates the rule. Its champion did change — Novo Nordisk rose to about $600 billion in 2024 and fell to about $203 billion by September 2026, outside the top ten — and ASML replaced it at about $667 billion. Yet Europe did not concentrate, because its index spreads across many industries and countries. India shows a large market standing still: Reliance was the most valuable company at $190bn in 2020 and $185bn in 2025, with eight of the ten names unchanged, because no AI layer sits inside it. Vietnam is physically inside the chain but financially outside it; Vingroup stayed first at about $21 billion while FPT rose, and the VN-Index gained 41% in 2025. The chapter concludes that concentration follows the chain, not the country, and that the size of an economy is irrelevant. What you own is what the fund holds, not what it is called.
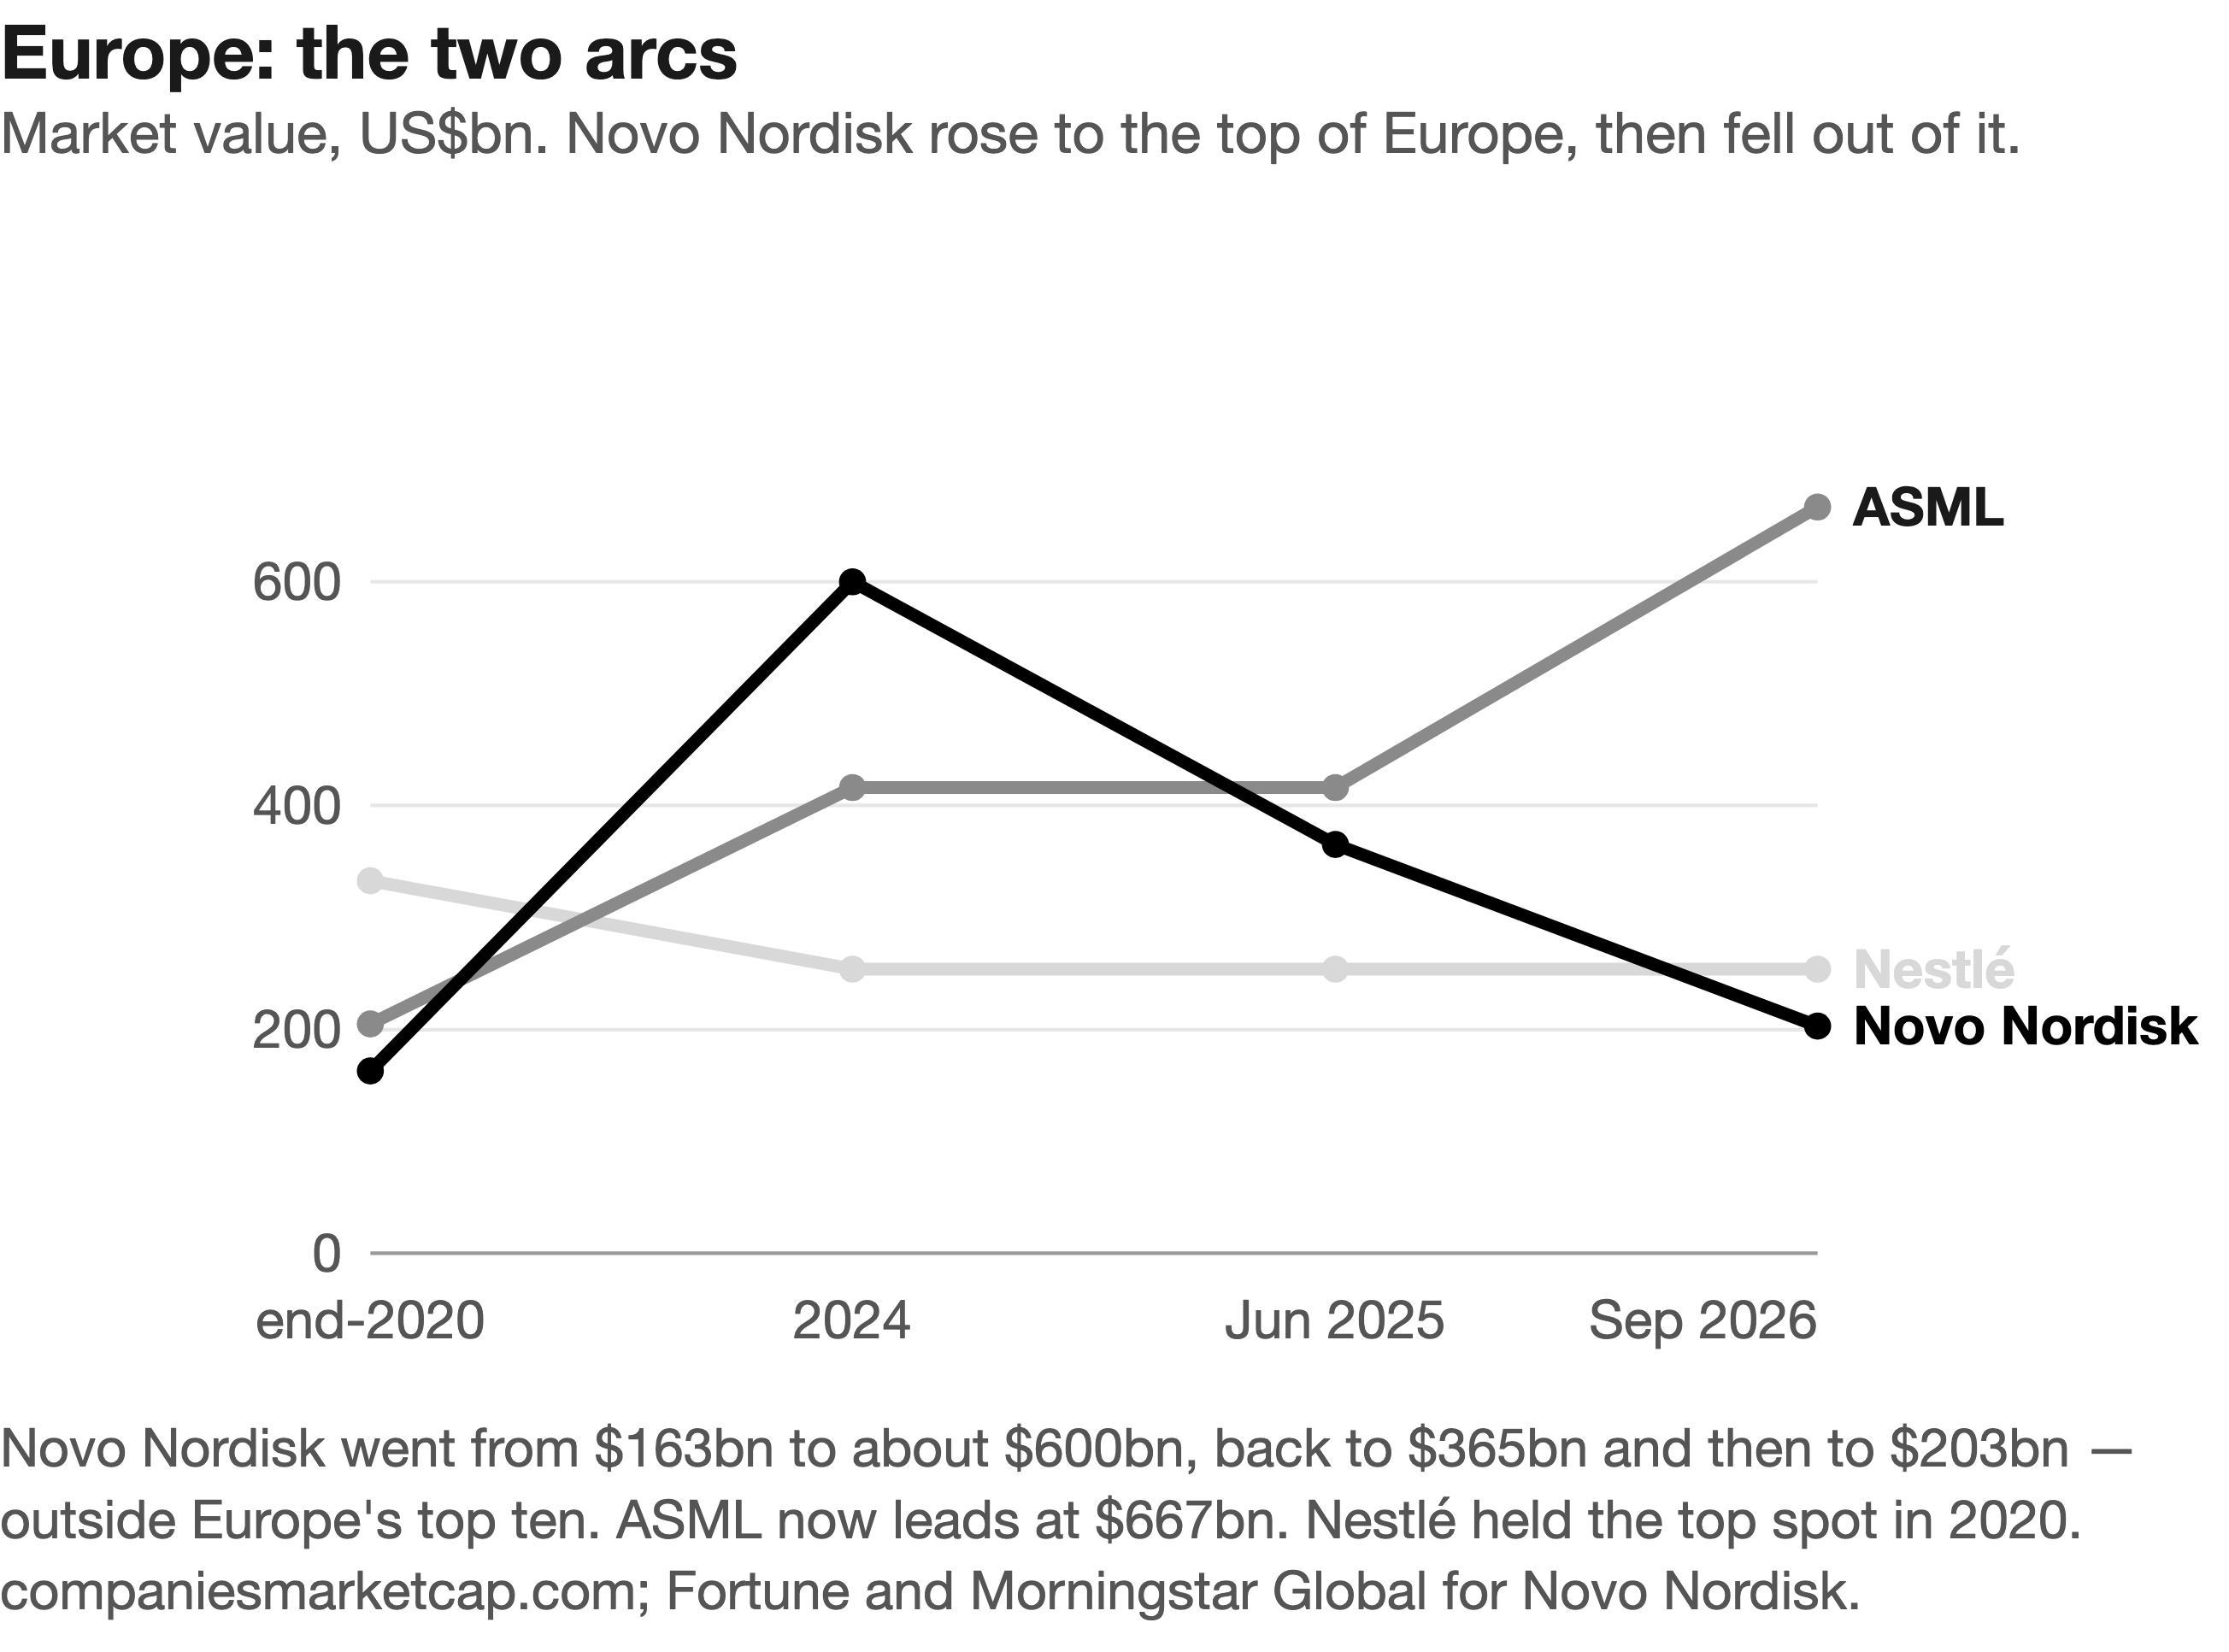
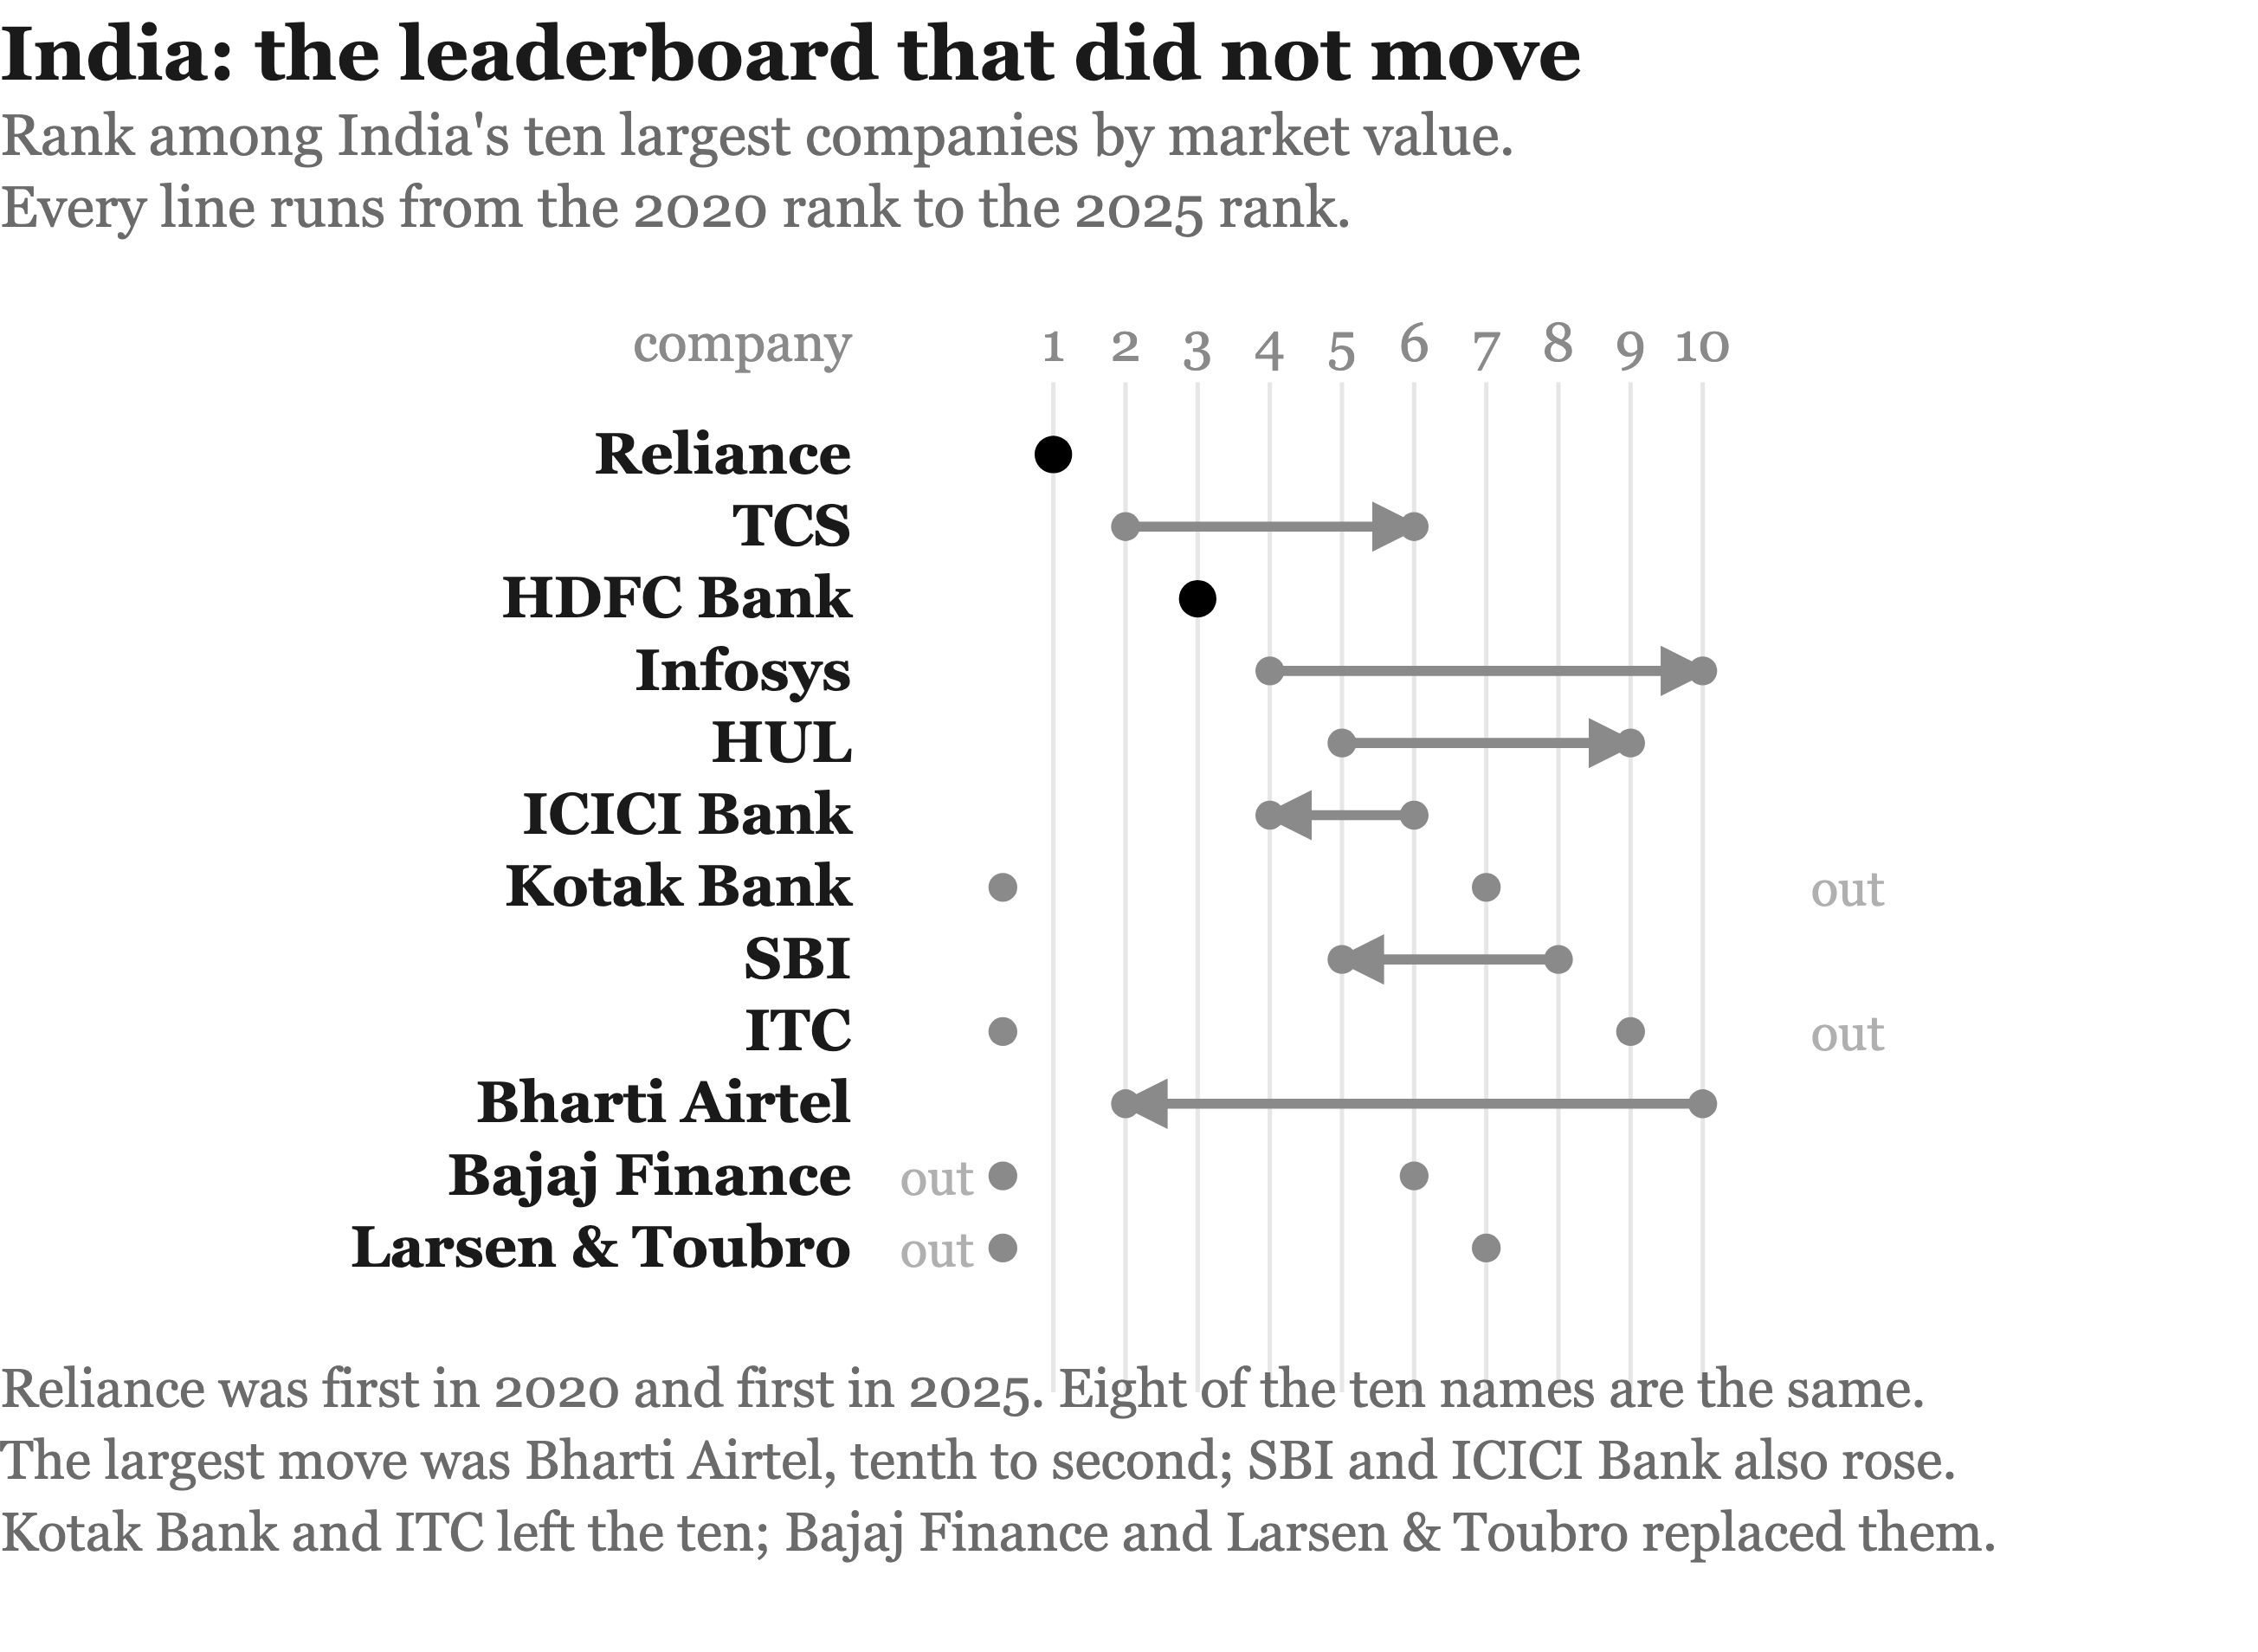
Table 3-1.
| Rank | End-2020 | End-2025 |
|---|---|---|
| 1 | Nestlé $333bn | ASML $416bn |
| 2 | LVMH $317bn | LVMH $369bn |
| 3 | Roche $299bn | Roche $331bn |
| 4 | ASML $205bn | AstraZeneca $288bn |
| 5 | Novo Nordisk $163bn | SAP $288bn |
| 6 | SAP $157bn | HSBC $275bn |
| 7 | Unilever $157bn | Novartis $267bn |
| 8 | AstraZeneca $131bn | Nestlé $254bn |
| 9 | TotalEnergies $115bn | Novo Nordisk $233bn |
| 10 | Shell $73bn | Siemens $219bn |
Table 3-2.
| # | End-2020 | End-2025 | ||
|---|---|---|---|---|
| 1 | Reliance | $190B | Reliance | $185B |
| 2 | TCS | $140B | Bharti Airtel | $126B |
| 3 | HDFC Bank | $110B | HDFC Bank | $121B |
| 4 | Infosys | $75B | ICICI Bank | $106B |
| 5 | HUL | $60B | SBI | $100B |
| 6 | ICICI Bank | $50B | TCS | $86B |
| 7 | Kotak Bank | $45B | Bajaj Finance | $70B |
| 8 | SBI | $40B | Larsen & Toubro | $59B |
| 9 | ITC | $40B | HUL | $50B |
| 10 | Bharti Airtel | $38B | Infosys | $48B |
PART II — THE MONEY AND THE CHAIN
Chapter 4 rests on figures the companies themselves committed to rather than on estimates. Amazon, Microsoft, Alphabet and Meta spent between $410 billion and $416 billion on capital projects in 2025 and guided to about $725 billion for 2026, a 77% increase. The chapter walks the build-out year by year, from almost $97bn in 2020, and notes that every revision during 2026 went up — Alphabet to $195–205 billion, Meta to $125–145 billion. Microsoft's apparent fall, from about $190 billion to $175 billion, was an accounting change: it extended building lives from fifteen to twenty-five years. Microsoft also attributed about $25 billion of its budget to higher component prices. Goldman Sachs models roughly $7.6 trillion of cumulative spending between 2026 and 2031, from $765 billion in 2026 to $1.64 trillion in 2031, and Sequoia's David Cahn put the revenue needed at roughly $600 billion against a $500 billion hole. The takeaway is that the path, not the total, carries the cancellation risk, and that four-company and five-company totals must never share a column.
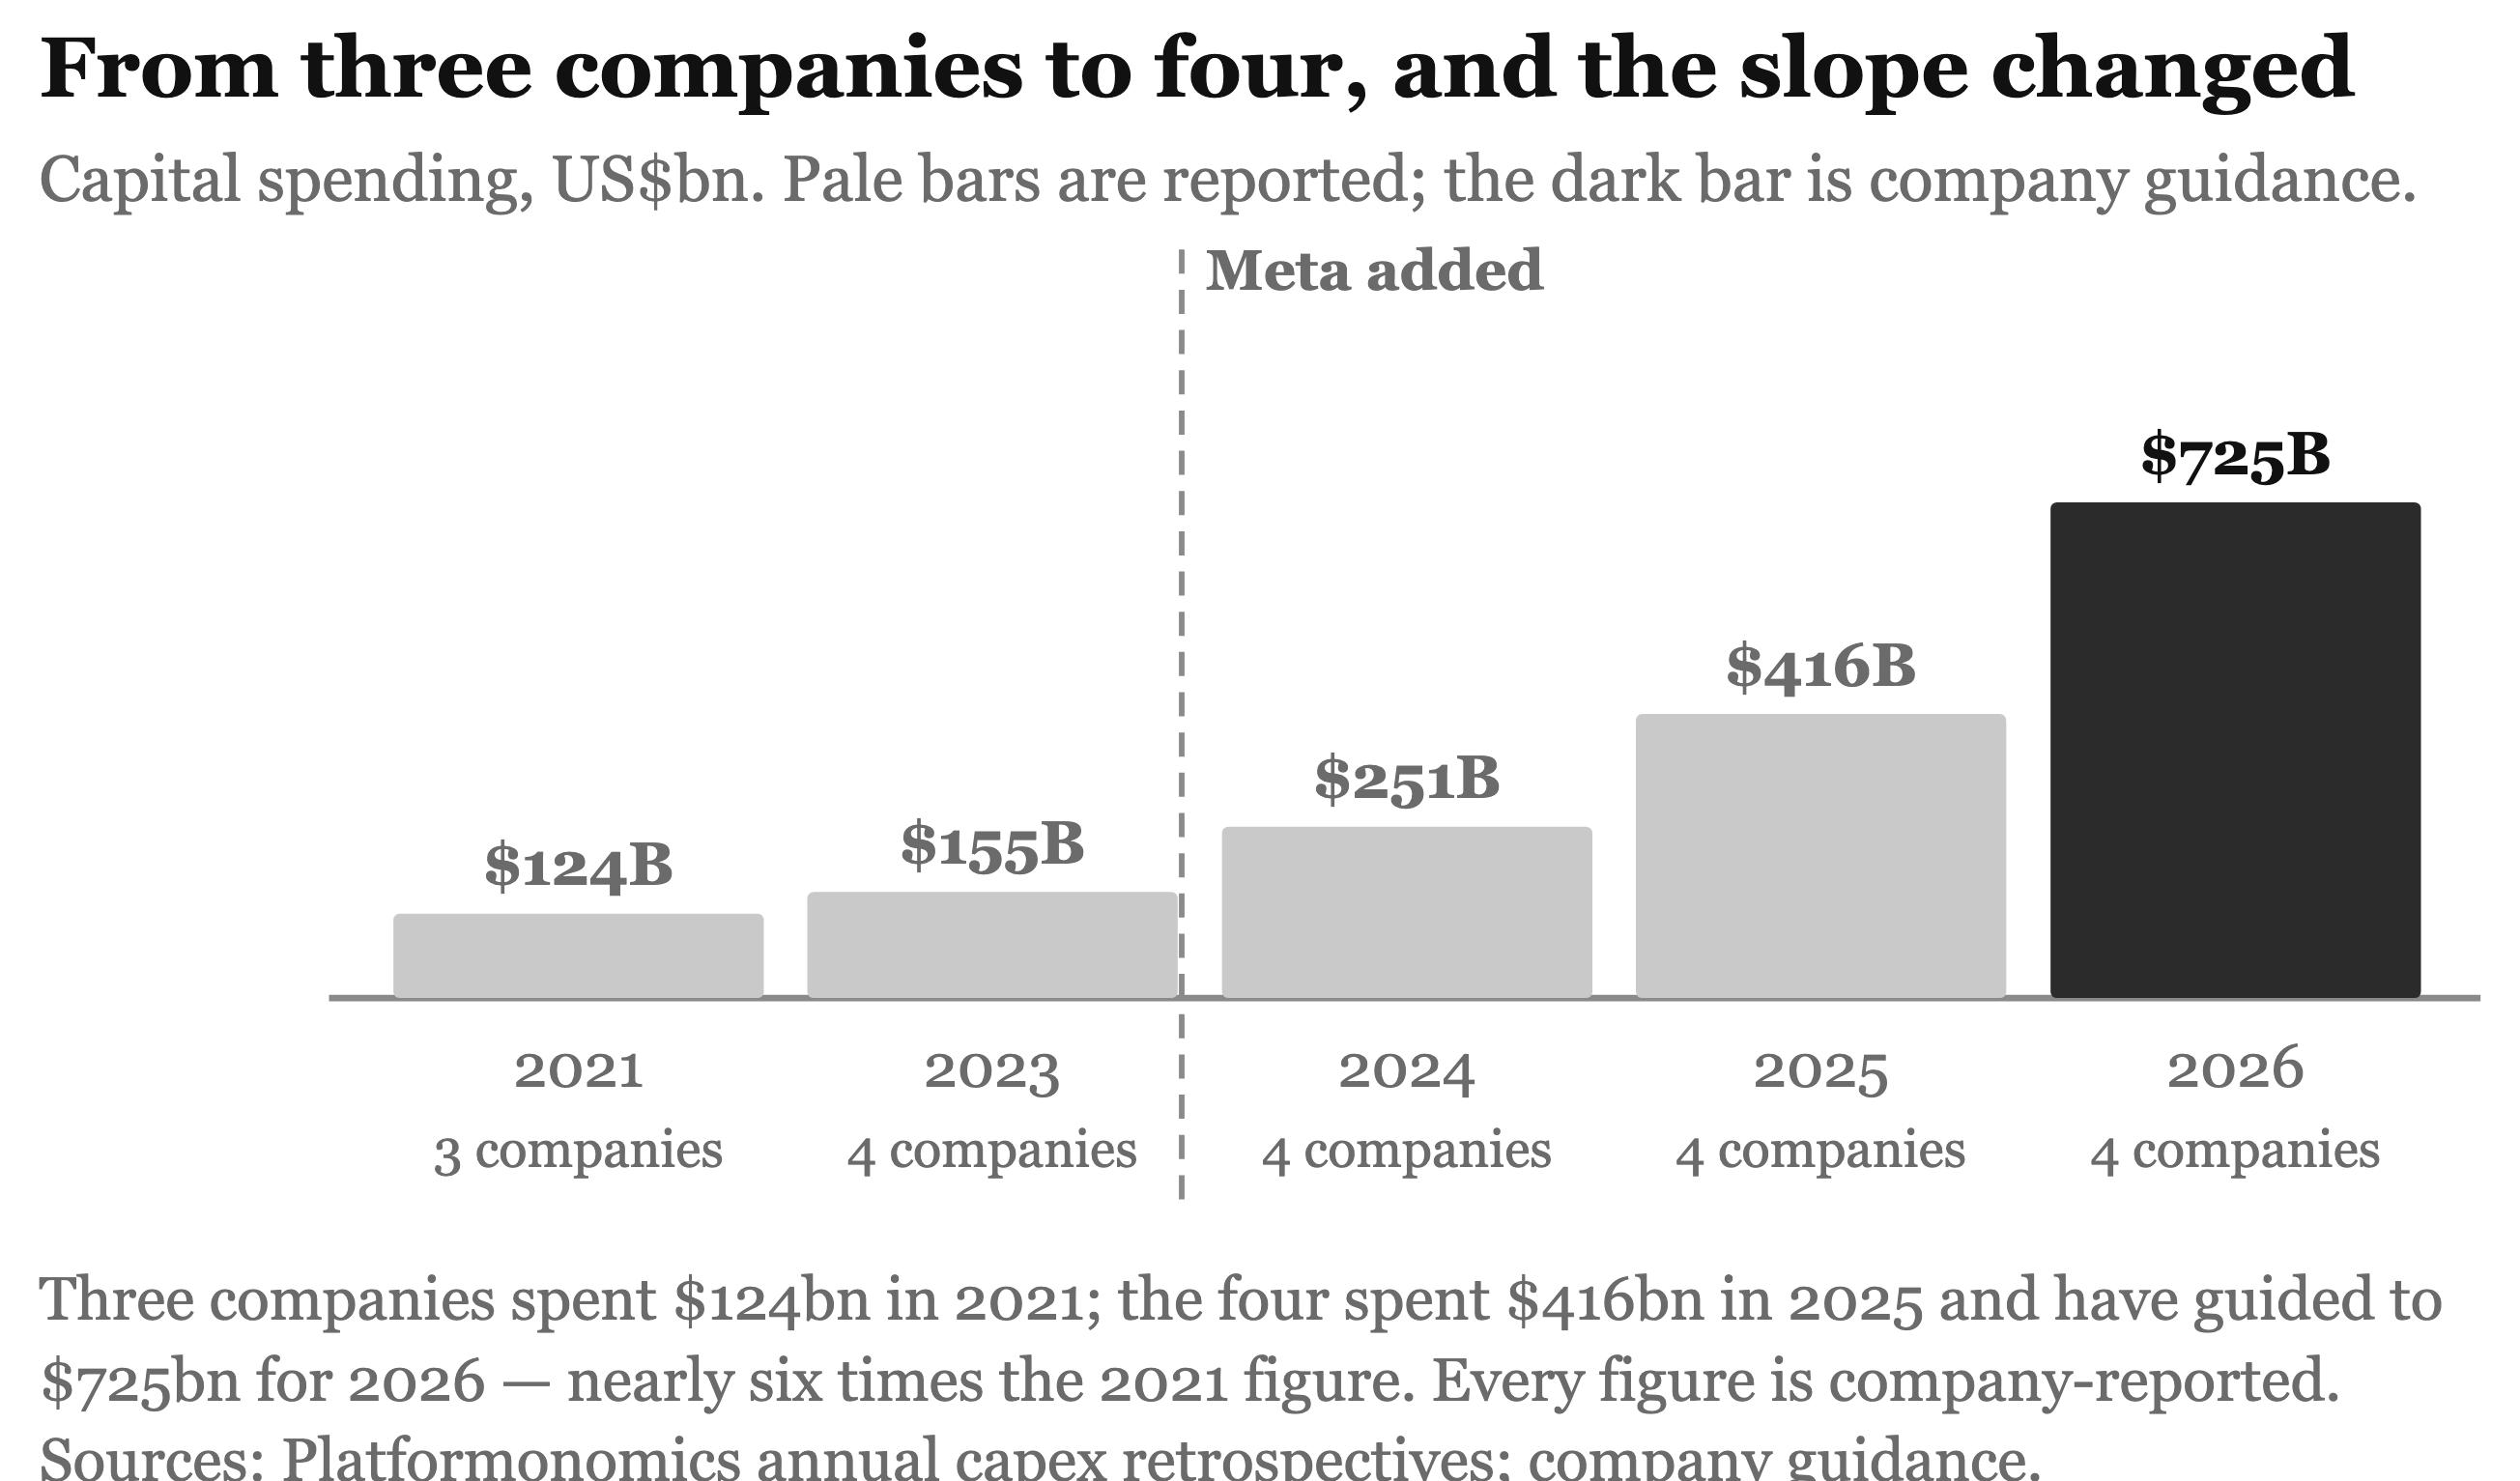
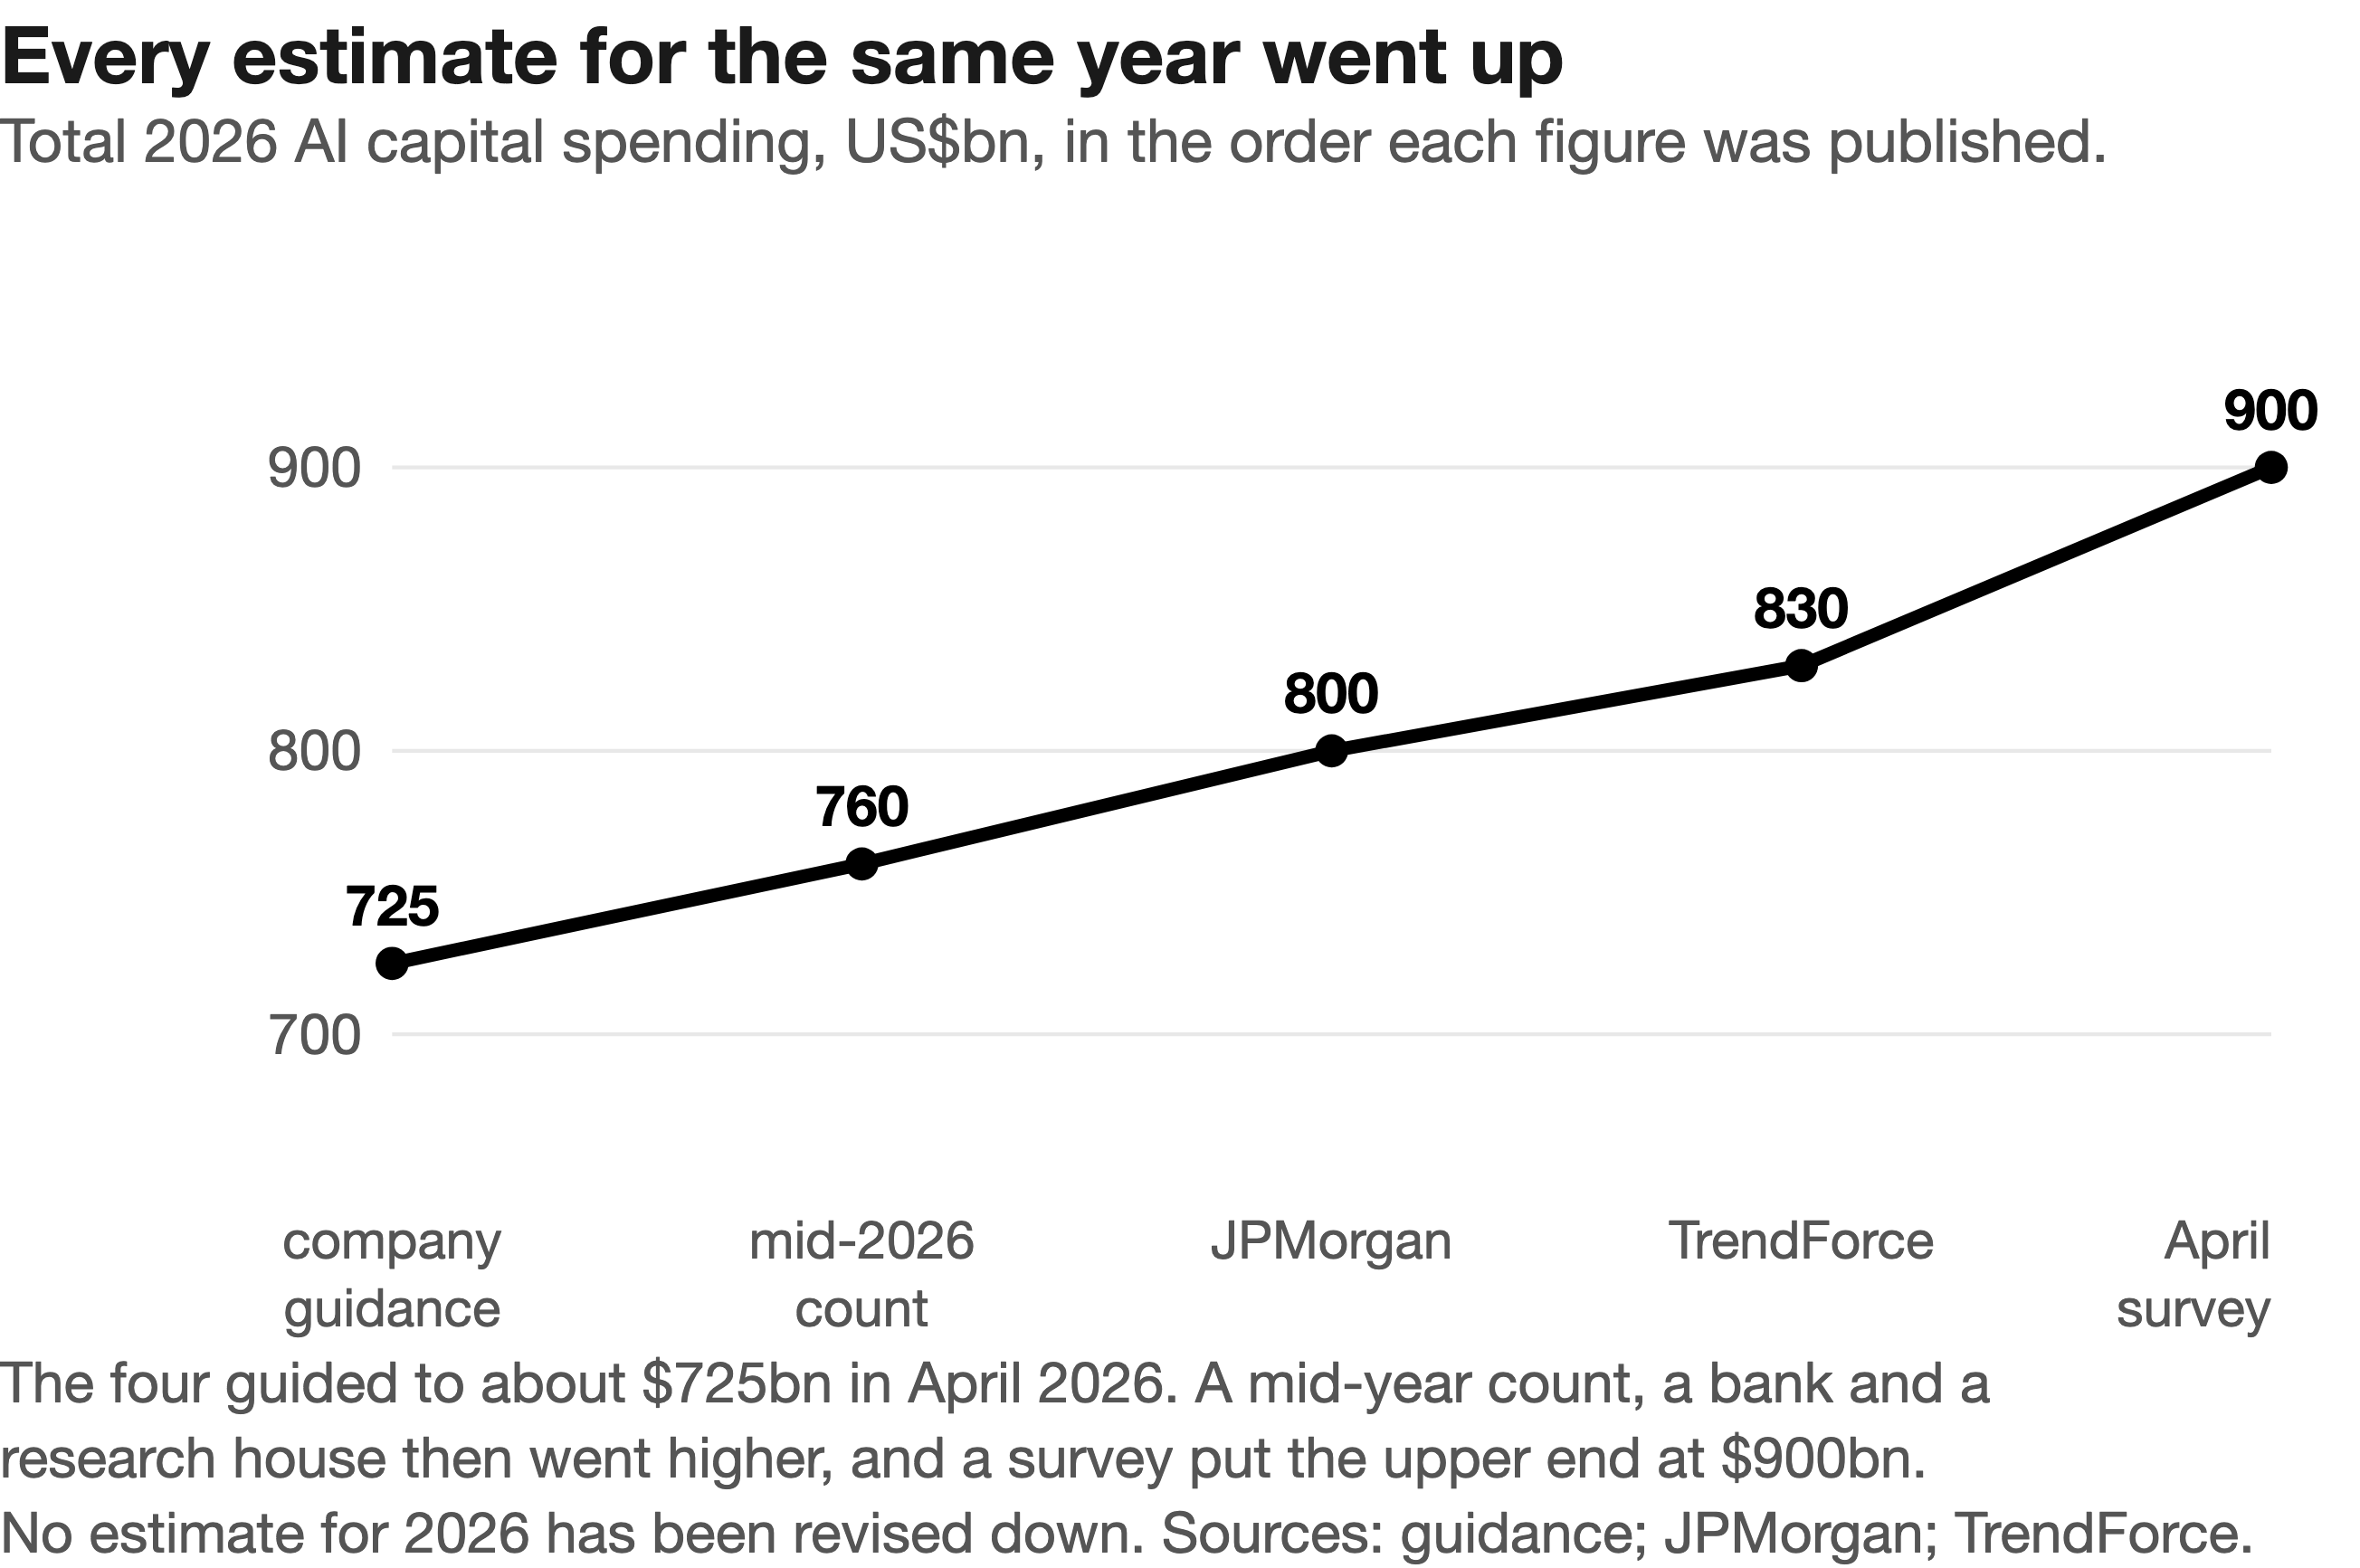
Table 4-4.
| Year | Capital spending | Basis |
|---|---|---|
| 2020 | almost $97bn | actual, three companies |
| 2021 | over $124bn | actual, three companies |
| 2022 | over $127bn | actual, three companies |
| 2023 | $155bn | actual, four companies — Meta added |
| 2024 | $251bn | actual, four companies, up 62% |
| 2025 | over $416bn | actual, four companies, up 66% |
| 2026 | about $700–765bn | company guidance is $725bn; industry estimates run higher |
| 2027 | over $1.0 trillion | analyst estimates |
| 2030 | about $1.55 trillion | industry estimate |
| 2031 | about $1.64 trillion | Goldman Sachs estimate |
| 2026–2031 | about $7.6 trillion | Goldman Sachs, cumulative |
Table 4-1.
| Year | Capital spending | Kind | Companies |
|---|---|---|---|
| 2020 | almost $97B | actual | Amazon, Google, Microsoft — three |
| 2021 | over $124B | actual | Amazon, Google, Microsoft — three |
| 2022 | over $127B | actual | Amazon, Google, Microsoft — three |
| 2023 | $155B | actual | the four, Meta added |
| 2024 | $251B, up 62% | actual | the four |
| 2025 | over $416B, up 66% | actual | the four |
| 2026 | about $725B, up 77% | company guidance | the four |
| 2027 | over $1.0 trillion | analyst estimate | the four |
| 2026–2031, cumulative | about $7.6 trillion | Goldman Sachs estimate | the whole industry — compute, data centres, power |
Chapter 5 asks where the money for the build-out comes from. Through 2024 the spending was self-funding; by the second quarter of 2026 that had reversed. Alphabet's free cash flow turned negative for the first time since its 2004 listing, a $5.9 billion outflow against $44.9 billion of capital spending, and the four largest buyers spent $171.2 billion in the quarter with aggregate free cash flow near zero. Morgan Stanley calculates that of about $2.9 trillion of global data-centre spending through 2028, about $1.4 trillion is funded internally and about $1.5 trillion must be borrowed, with roughly $800 billion expected from private credit. Hyperscaler bond issuance reached about $220 billion by 10 August 2026. Meta's Hyperion campus used a joint venture in which Blue Owl holds 80% and $27.3 billion of debt sits off Meta's balance sheet. The chapter warns that the three conditions for the financing to work — cash flow, credit and equipment returns — fail together, and that extended depreciation schedules flatter present earnings.
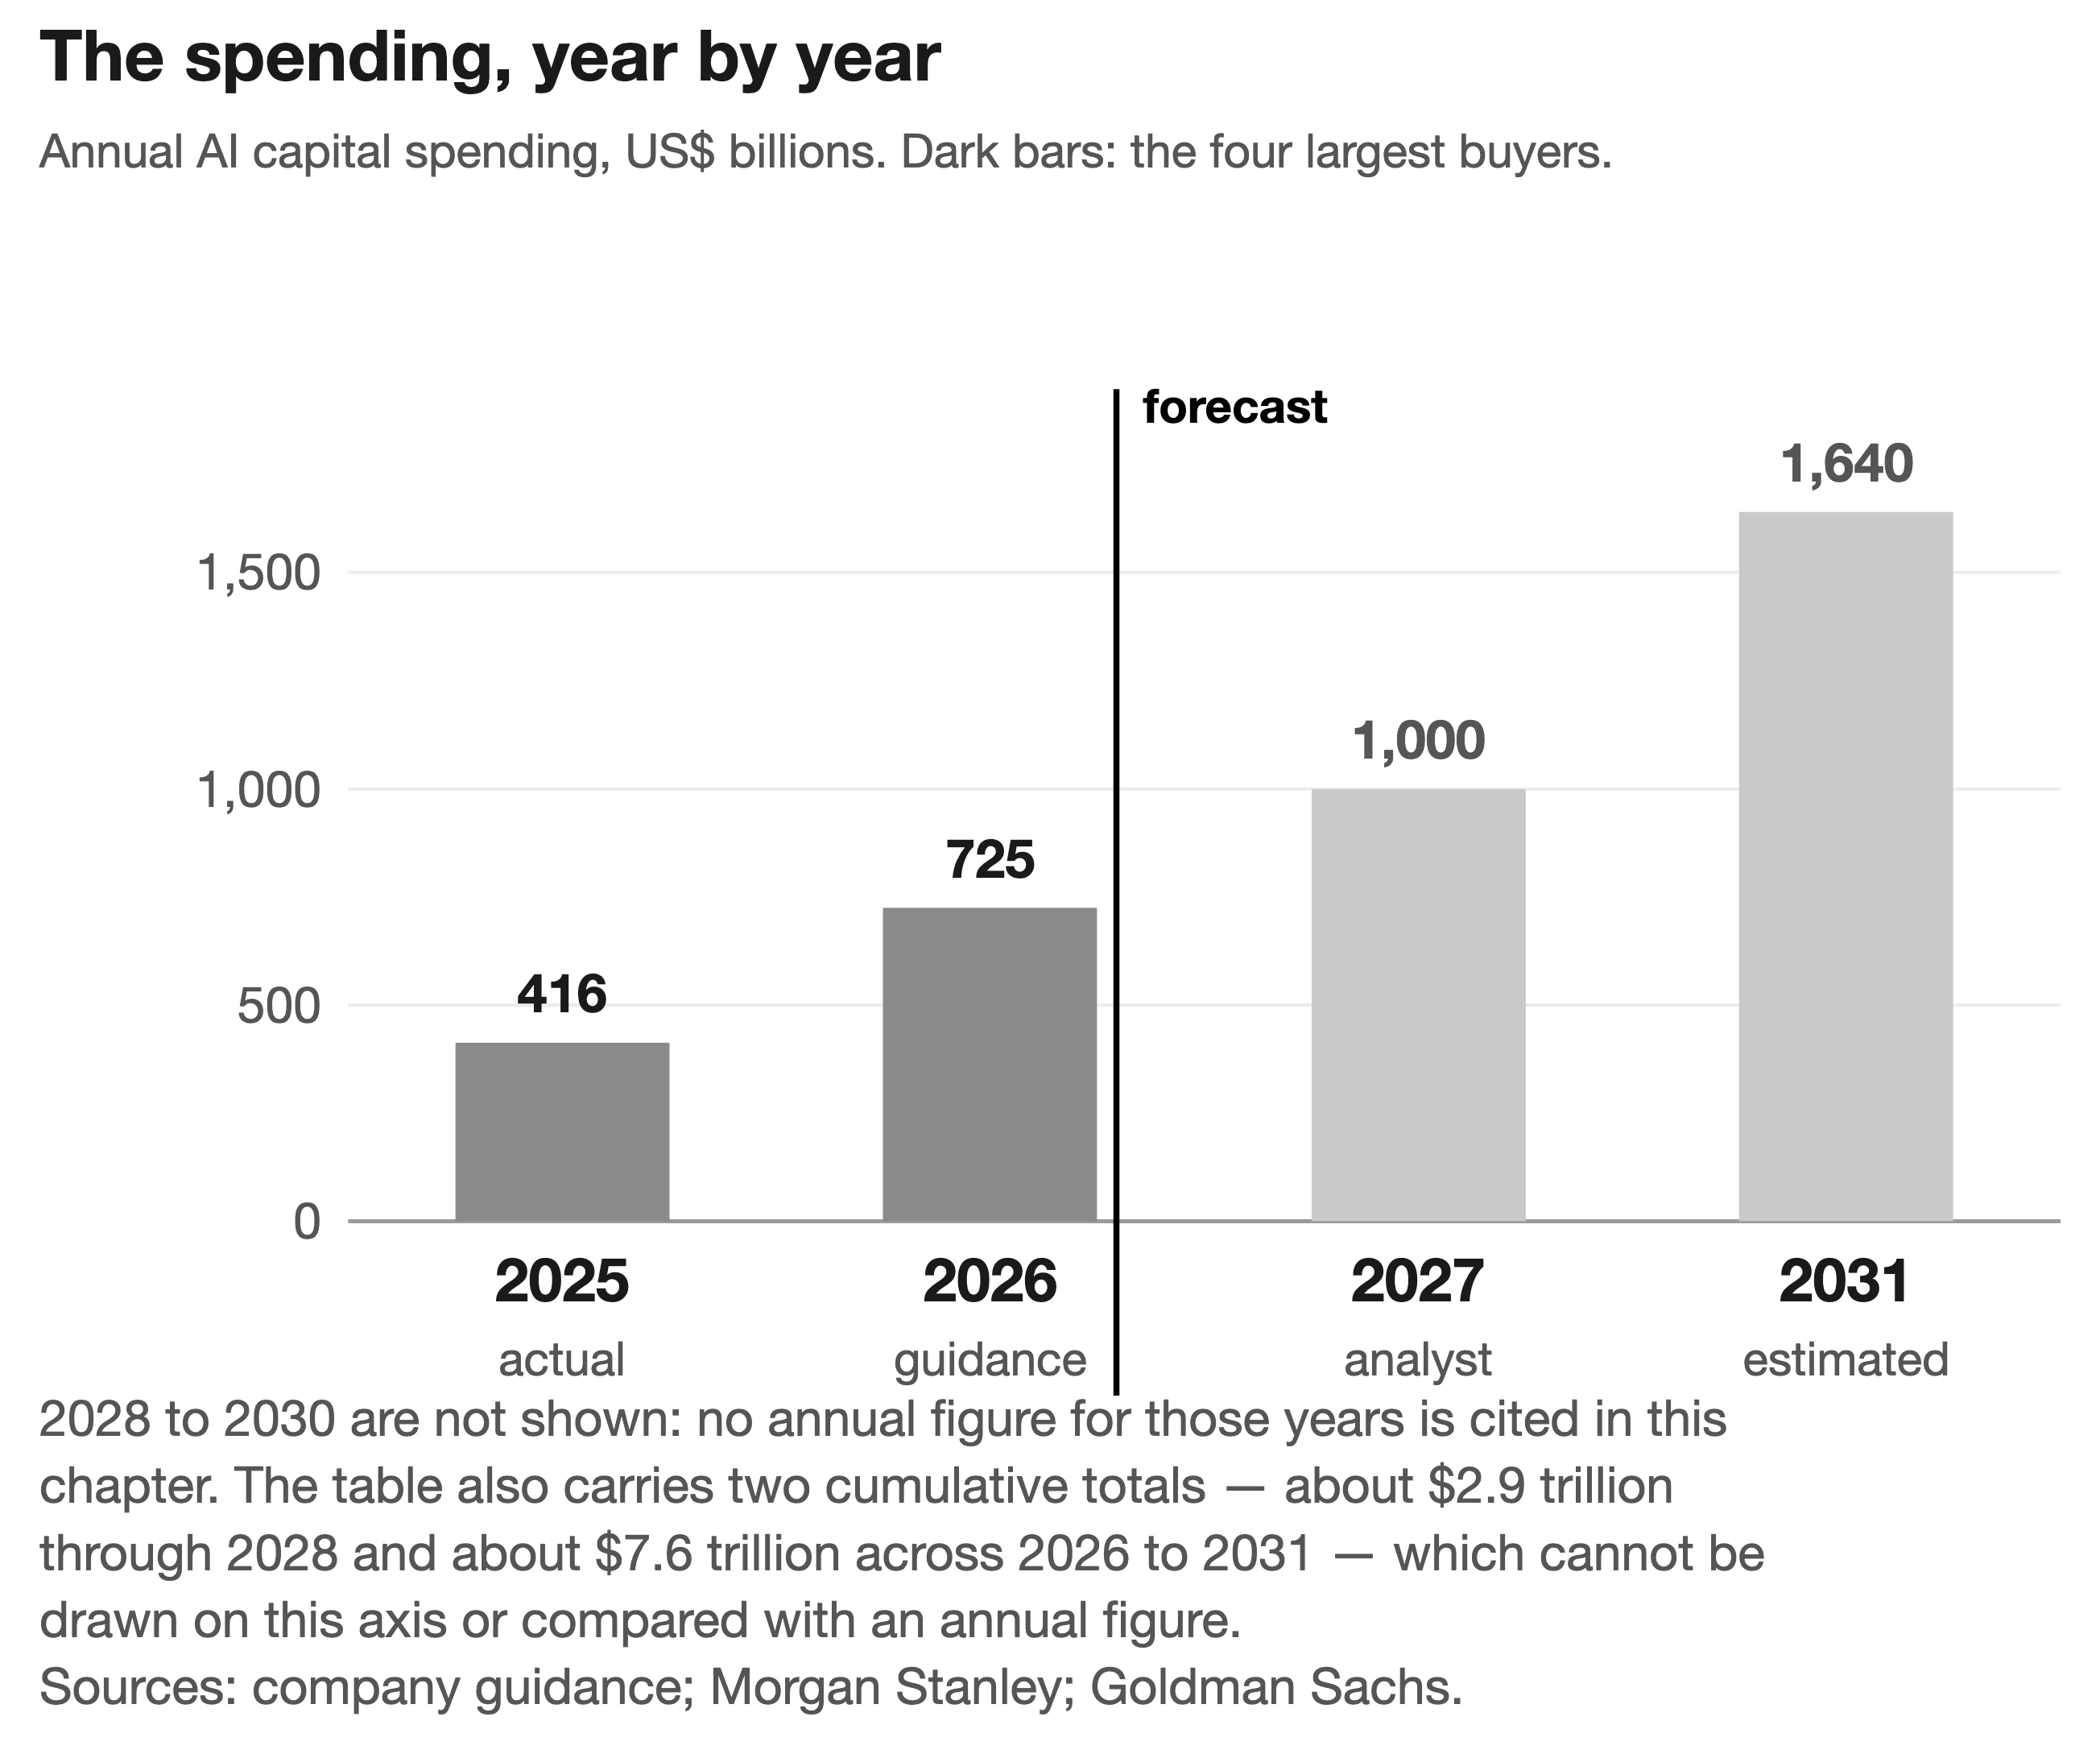
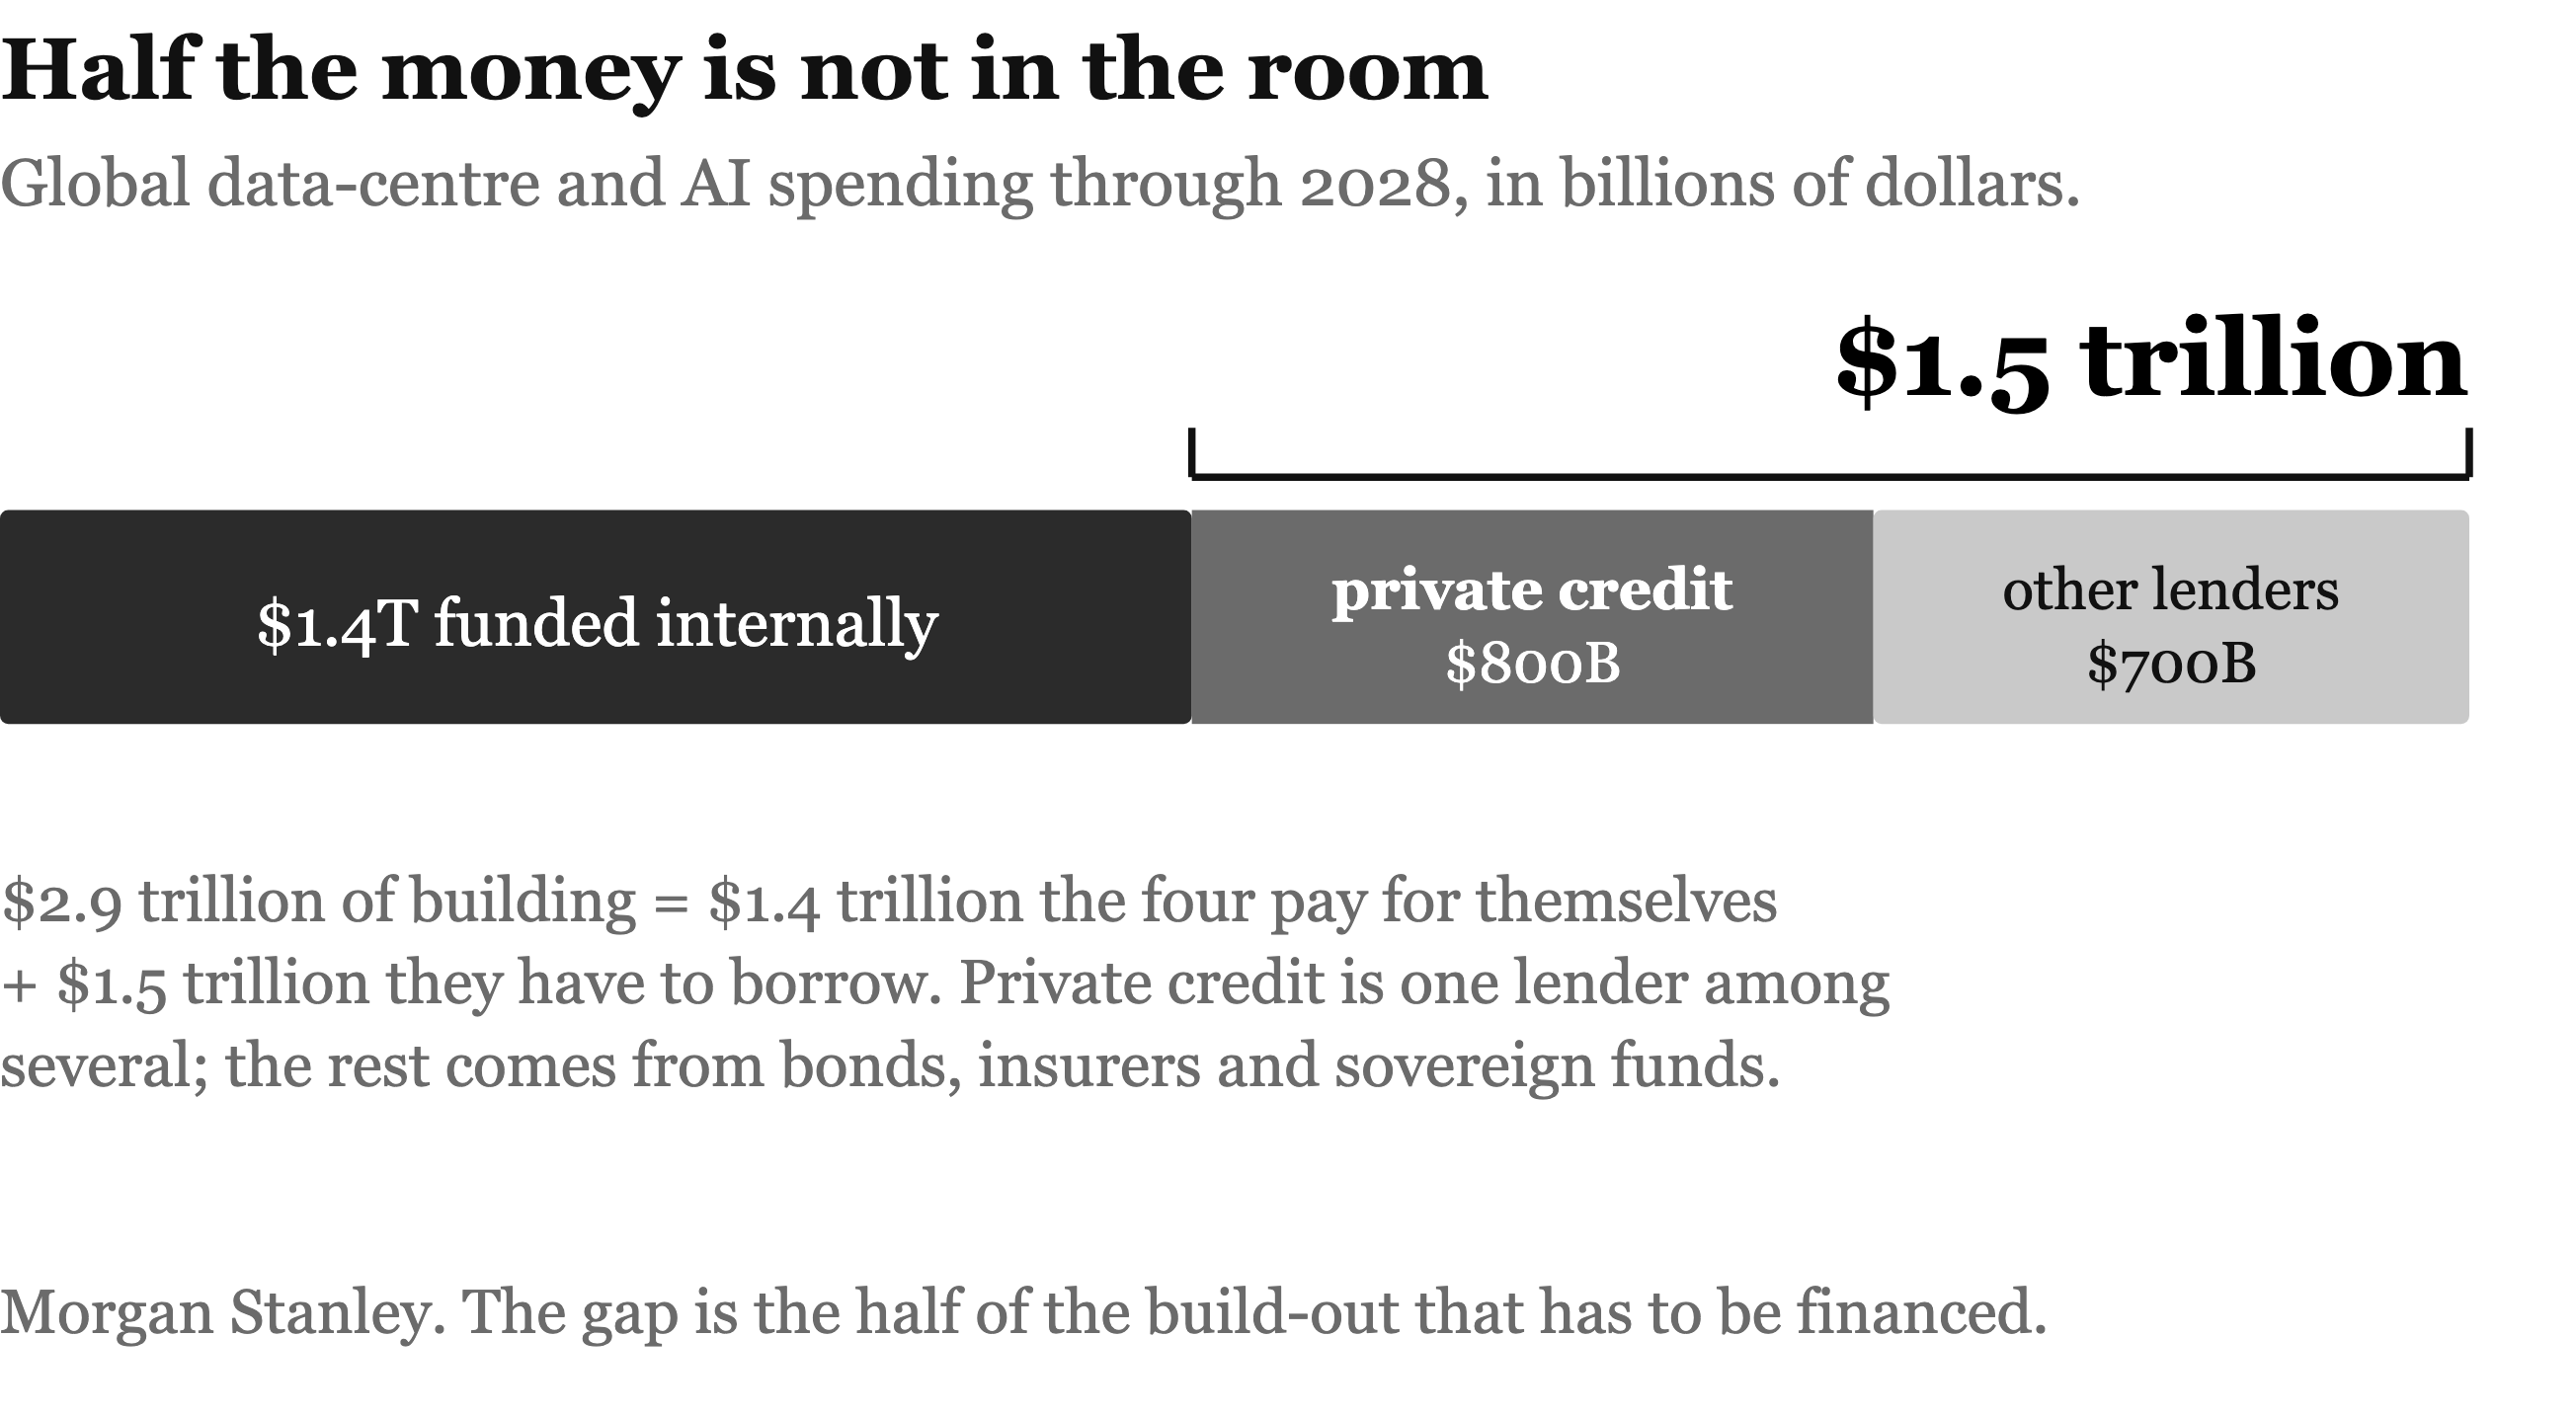
Table 5-1.
| Amount | Basis | |
|---|---|---|
| 2025, four largest buyers | $410–416B | actual |
| 2026, same four | ~$725B, up 77% | company guidance |
| 2027 | over $1.0 trillion | analyst estimate |
| Global data-centre spending through 2028 | ~$2.9 trillion | Morgan Stanley |
| Cumulative capital spending 2026–2031 | ~$7.6 trillion | Goldman Sachs |
| Annual AI capital spending by 2031 | ~$1.64 trillion | Goldman Sachs |
Table 5-4.
| Source | Scale as reported | What it is |
|---|---|---|
| Investment-grade bonds | about $220bn to 10 August 2026 | From a $28bn-a-year average in 2020–2024, and $121bn in 2025 |
| Private credit funds | $200bn+ outstanding; over $40bn originated in 2025 | A base near zero in 2020; $800bn projected through 2028 |
| Off-balance-sheet vehicles | $27.3bn of Meta's Hyperion, for example | Structured so the debt sits with a vehicle rather than the company |
| Sovereign wealth | MGX $49bn, HUMAIN $10bn | States treating computing capacity as a strategic asset |
| Insurance companies | not separately disclosed | Buying the debt that funds the construction |
Chapter 6 argues that the supply chain has no spare parts, and that each of three nodes is held by one or two companies. ASML builds the only advanced lithography machines; the book recounts how it sold 23% of itself to Intel, TSMC and Samsung in 2012, bought Cymer for $2.5 billion, and shipped the first EUV chip in October 2018. The three nodes are Nvidia at about $5.4 trillion and roughly 70–75% of AI accelerators; SK hynix and Samsung in memory, at $947 billion and about $1.27 trillion; and TSMC in foundry at $2.16 trillion and 72.5% of revenue. The HBM reversal is the centrepiece: SK hynix fell from 64% to 58% to 50% while Samsung rose from 15% to 21% to 33%, narrowing the gap from 49 points to 17. All three memory makers said their 2026 output was sold out. The chapter cautions that the widely quoted $70 billion a year by 2030 is bank research, not TSMC guidance, and that chokepoints attract the capital that eventually breaks them.
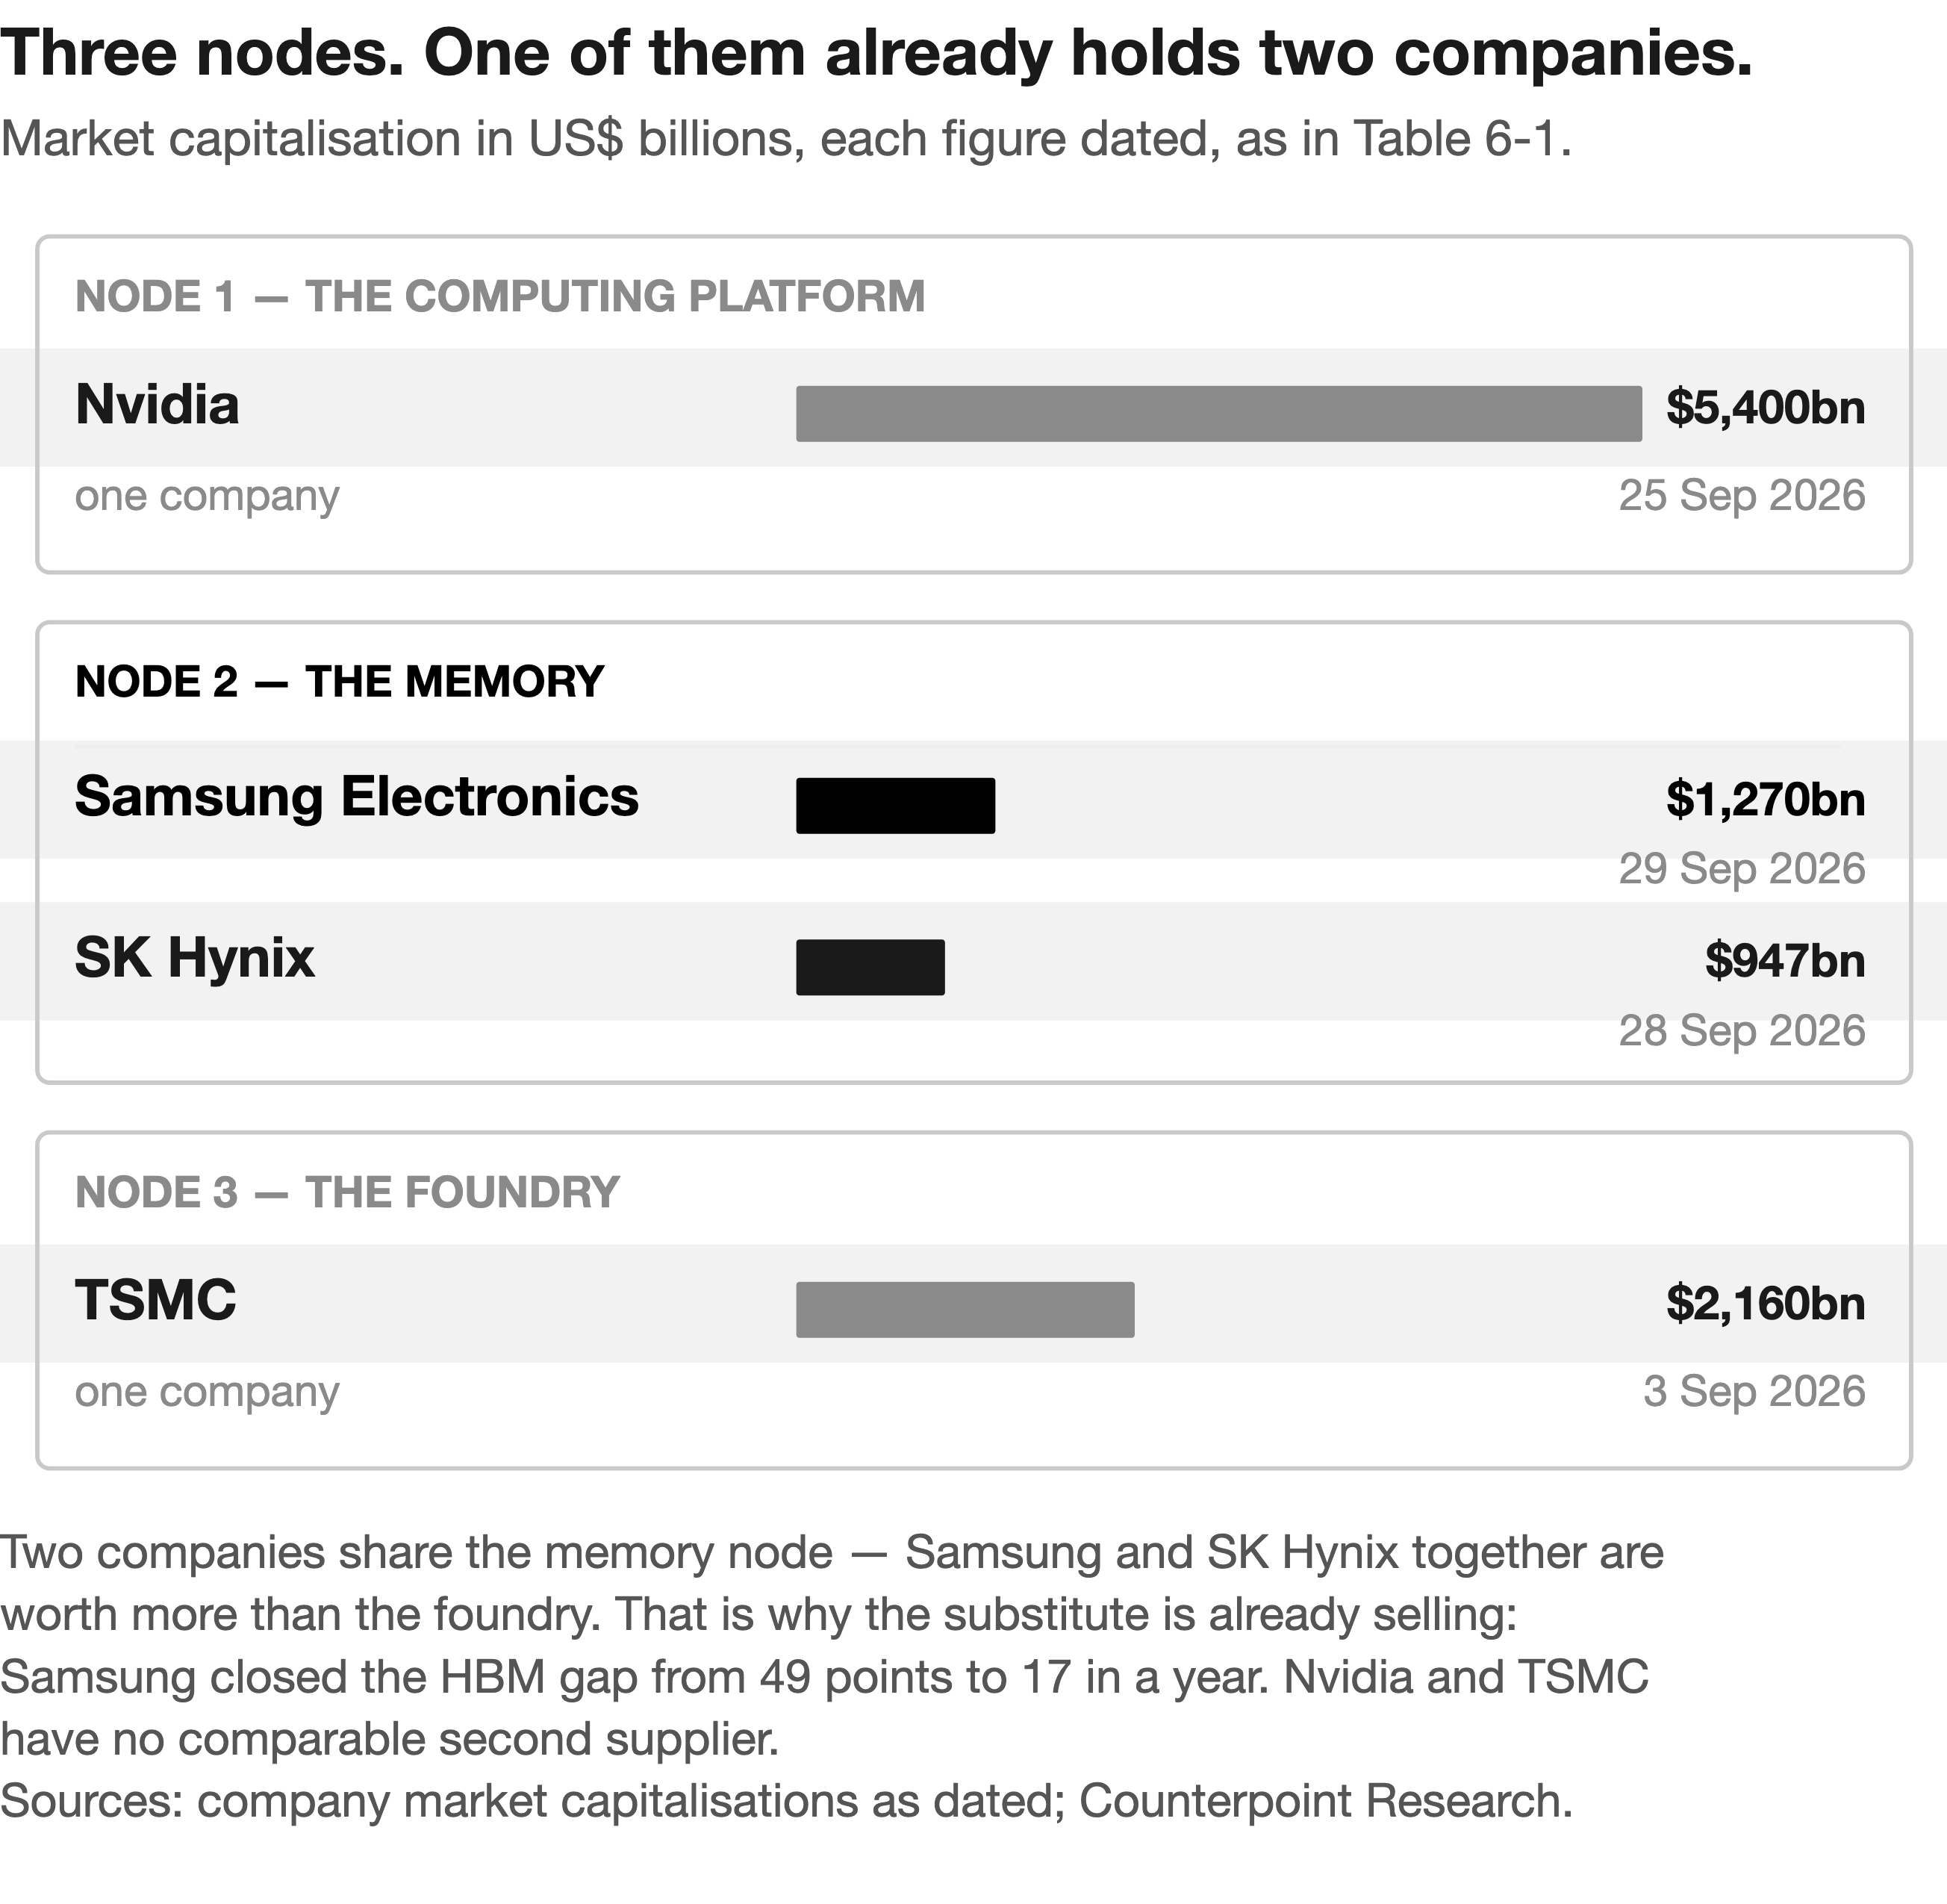
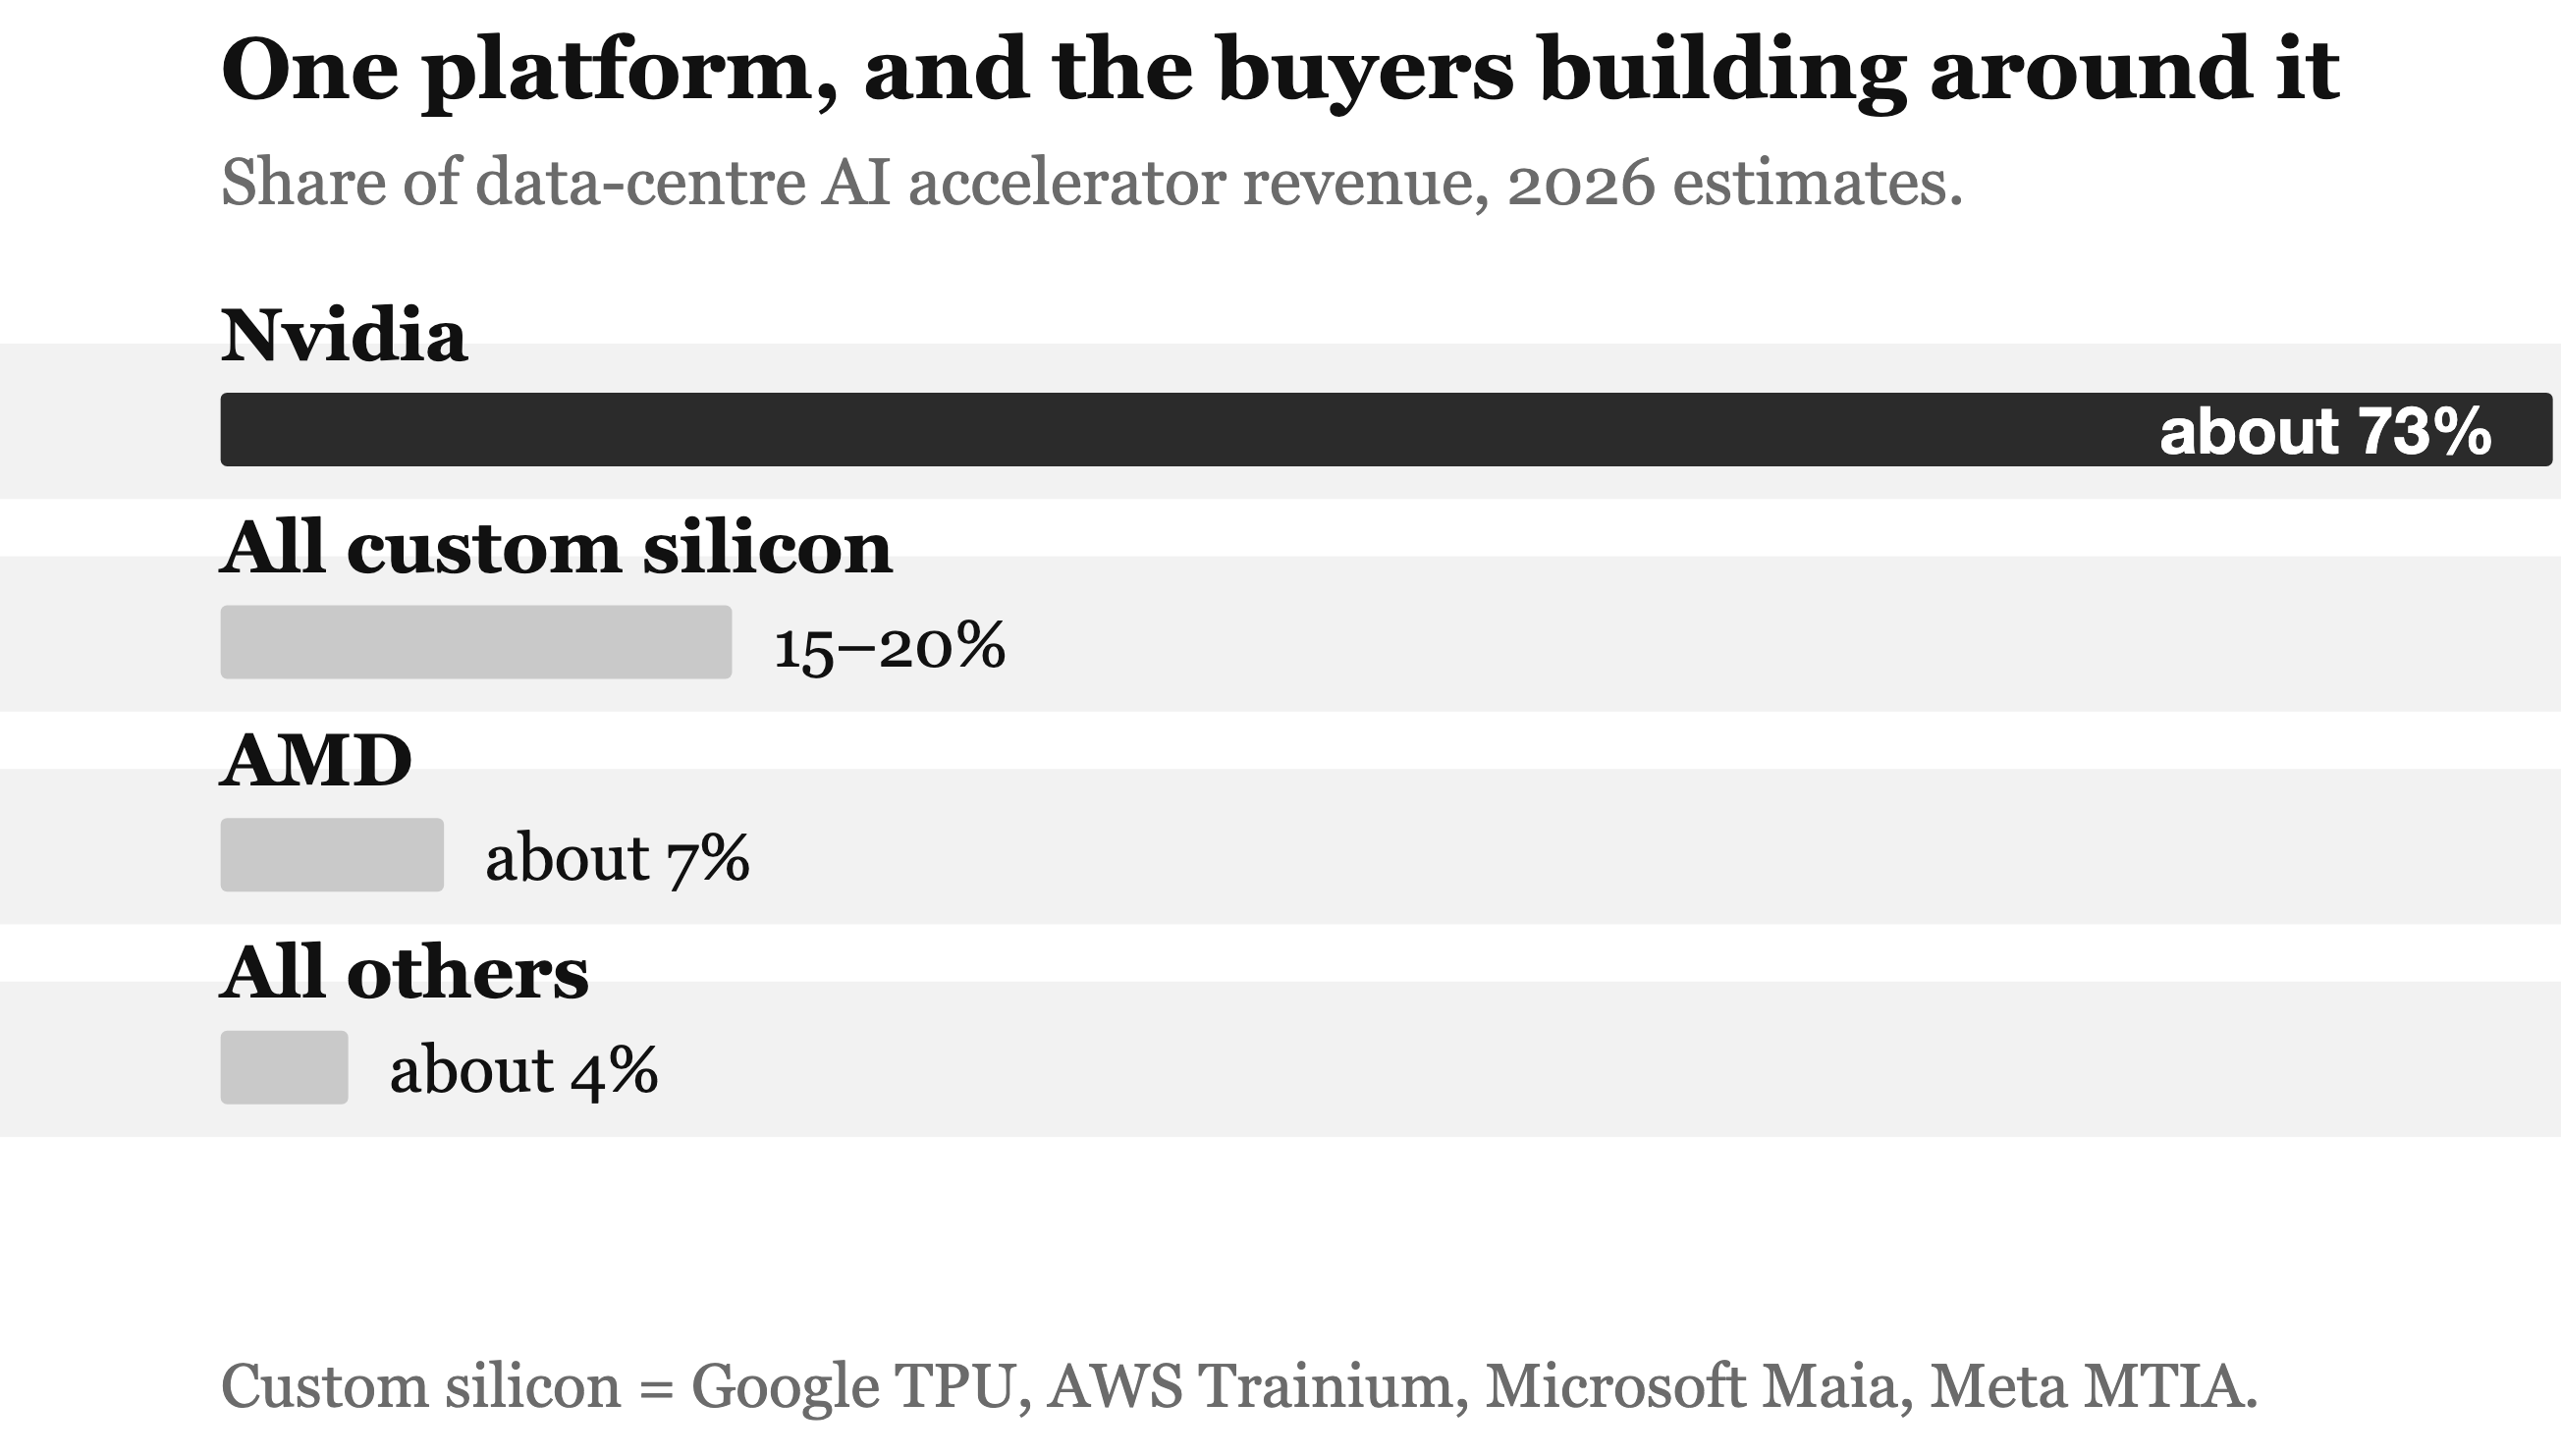
Table 6-1.
| Node | The company | Market capitalisation | What it holds |
|---|---|---|---|
| The computing platform | Nvidia | about $5.4 trillion (25 September 2026) | roughly 70–75% of AI accelerators; all custom silicon together holds 15–20% |
| The memory | SK hynix; Samsung Electronics | $947 billion (28 September) and about $1.27 trillion (29 September) | HBM revenue share in Q2 2026: SK hynix 50%, Samsung 33%, Micron 18% |
| The foundry | TSMC | $2.16 trillion (3 September 2026) | 72.5% of global foundry revenue in Q2 2026 |
Table 6-2.
| Company | What it said | When and where |
|---|---|---|
| SK hynix | HBM, DRAM and NAND capacity “essentially sold out” for 2026 | earnings call, October 2025 |
| Samsung | the same, and had begun taking orders for 2027, expecting a wider gap | first-quarter 2026 call |
| Micron | its 2026 HBM supply sold under fixed-price contracts | as reported |
Chapter 7 examines the second tier, the suppliers that enable the boom rather than define it, and argues that growth alone is not a business. Using trailing-twelve-month filings, it finds five companies grew faster than Nvidia — Sandisk at +175.3%, Applied Digital at +167.5%, Micron at +167.0%, Credo at +165.1% and CoreWeave at +115.3% — against Nvidia's +83.4%. The margin column is the story. Arm earns a 97.5% gross margin and Nvidia 74.7%, while Super Micro grew 78% but kept only 11 cents of each dollar, at 10.8%. Micron's gross margin went from −0.7% in the quarter ended November 2023 to 84.6% by May 2026. Ranked by layer, memory grew 126%, connectivity 67%, compute 49%, equipment 31% and power only 19% — the next bottleneck, priced as the old one. The takeaway is to check whether a company owns something its customers cannot get elsewhere or merely assembles what others designed.
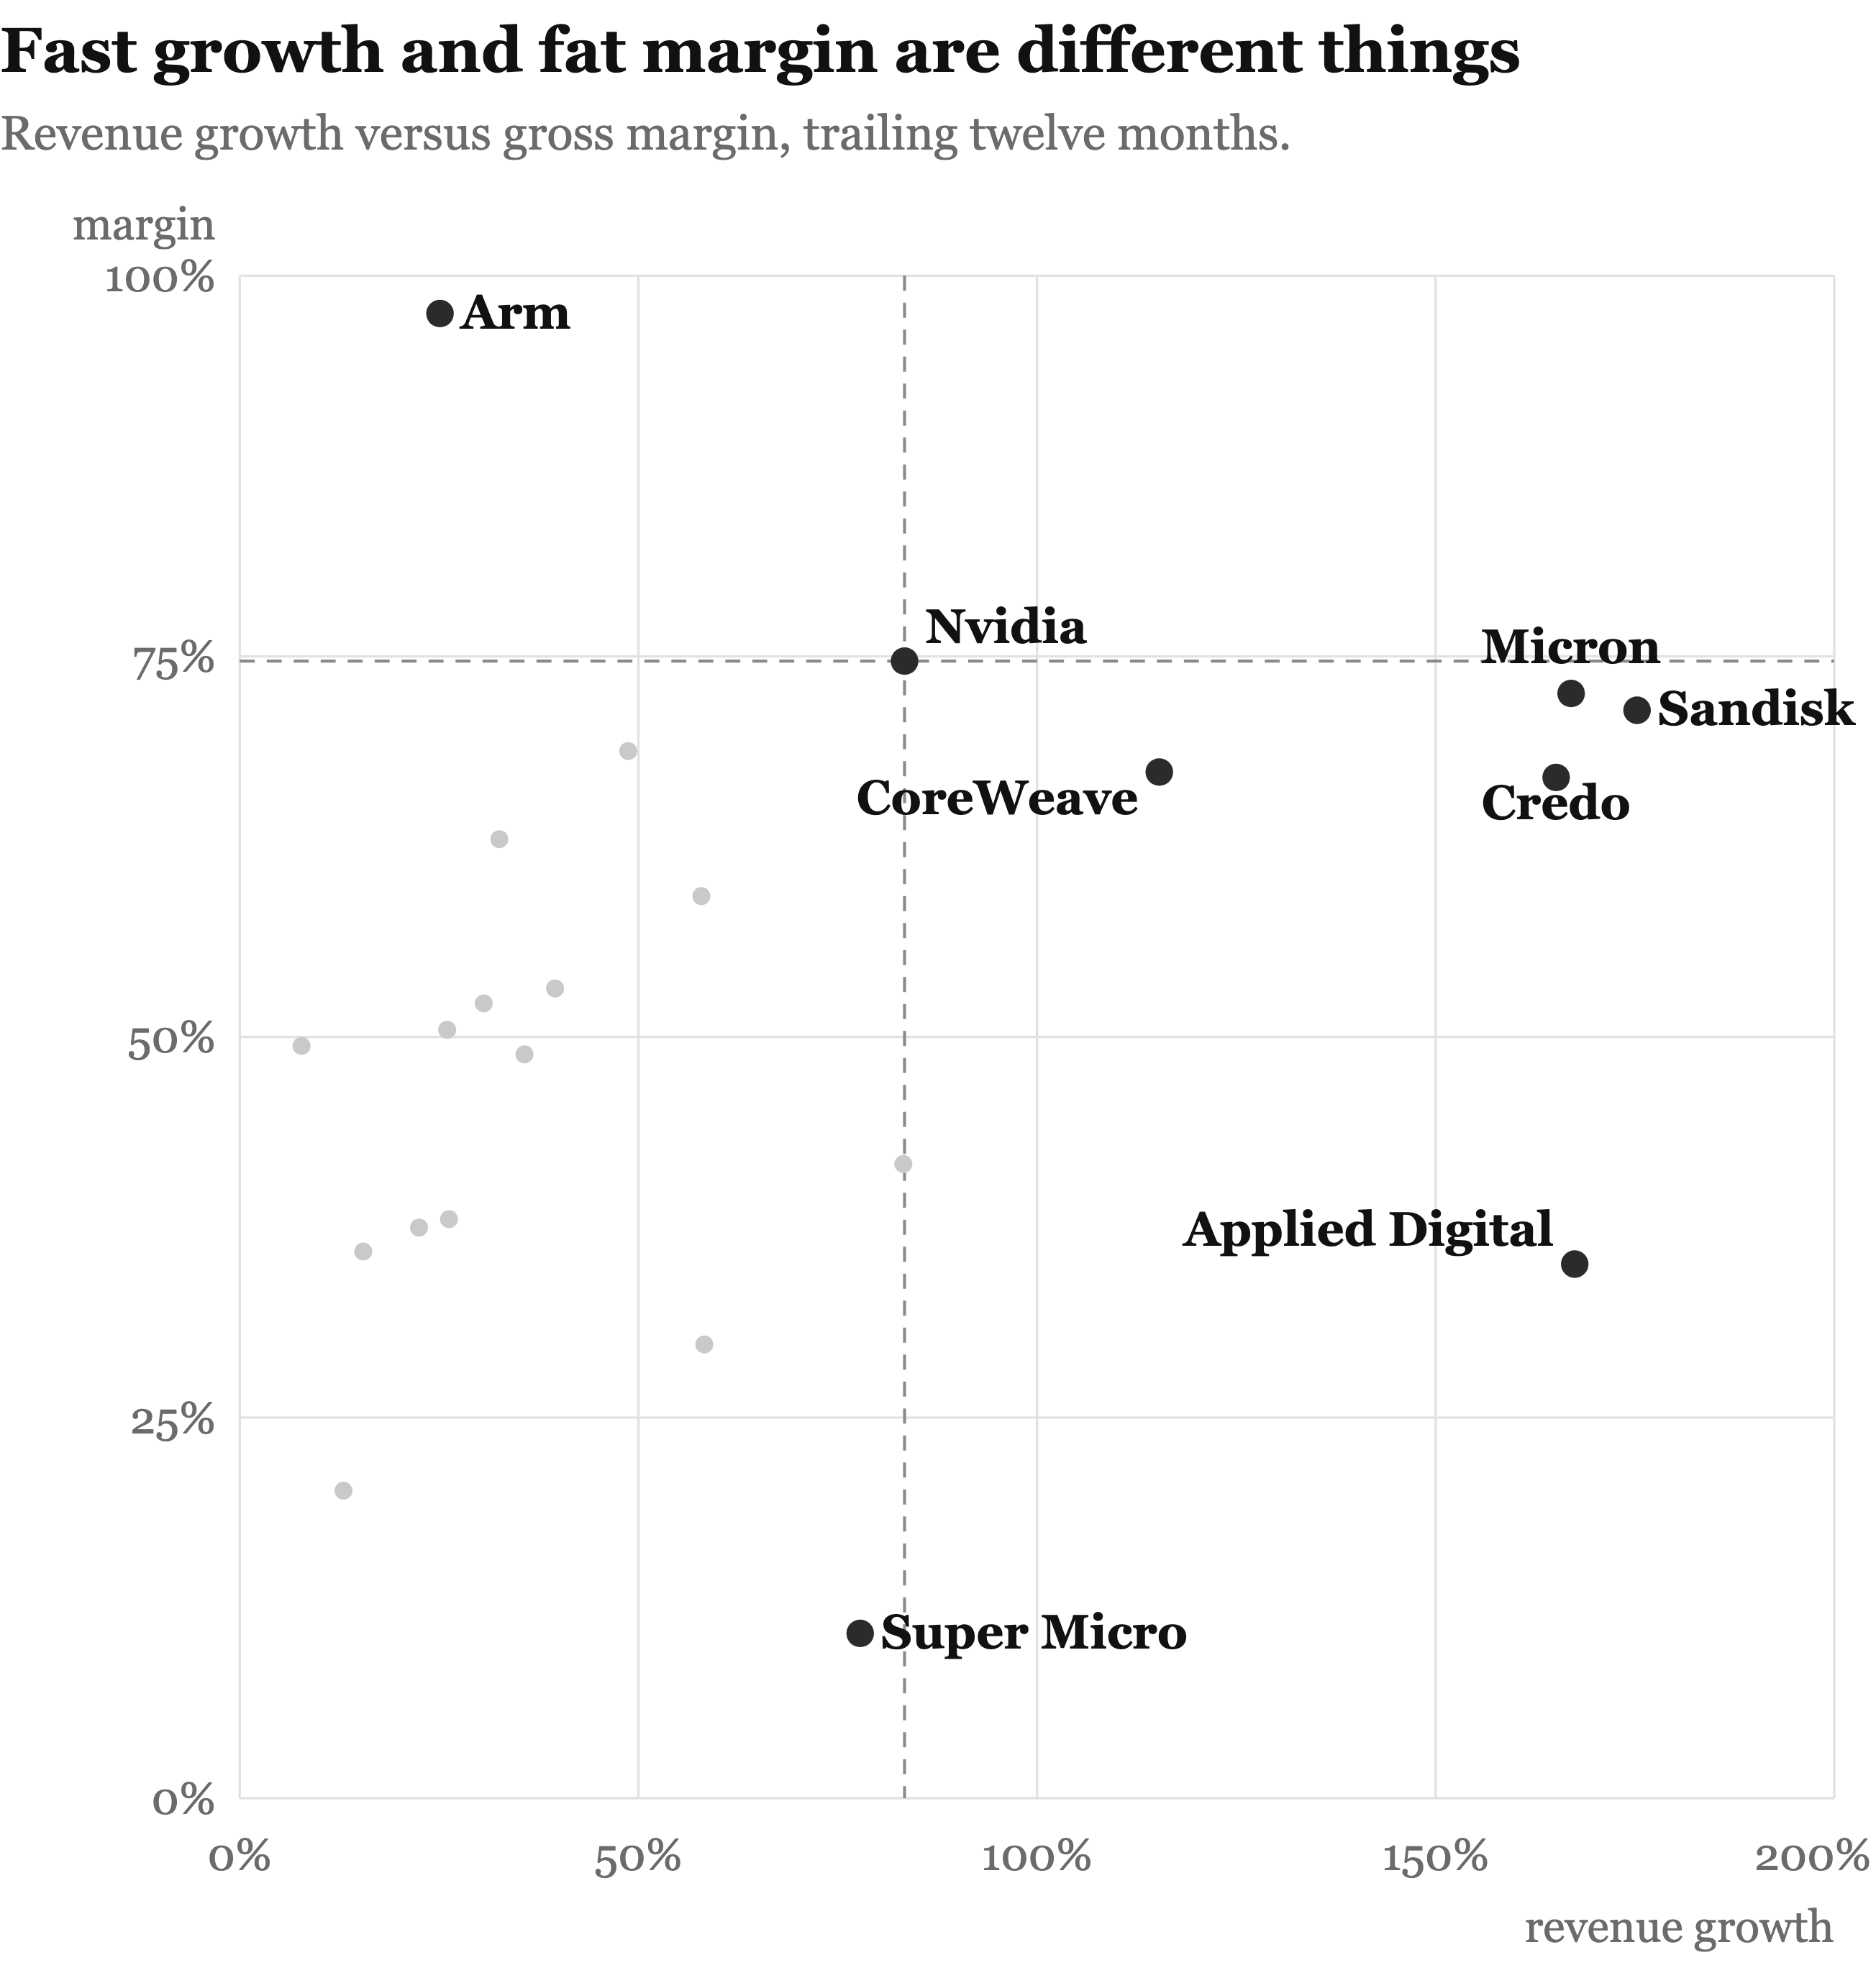
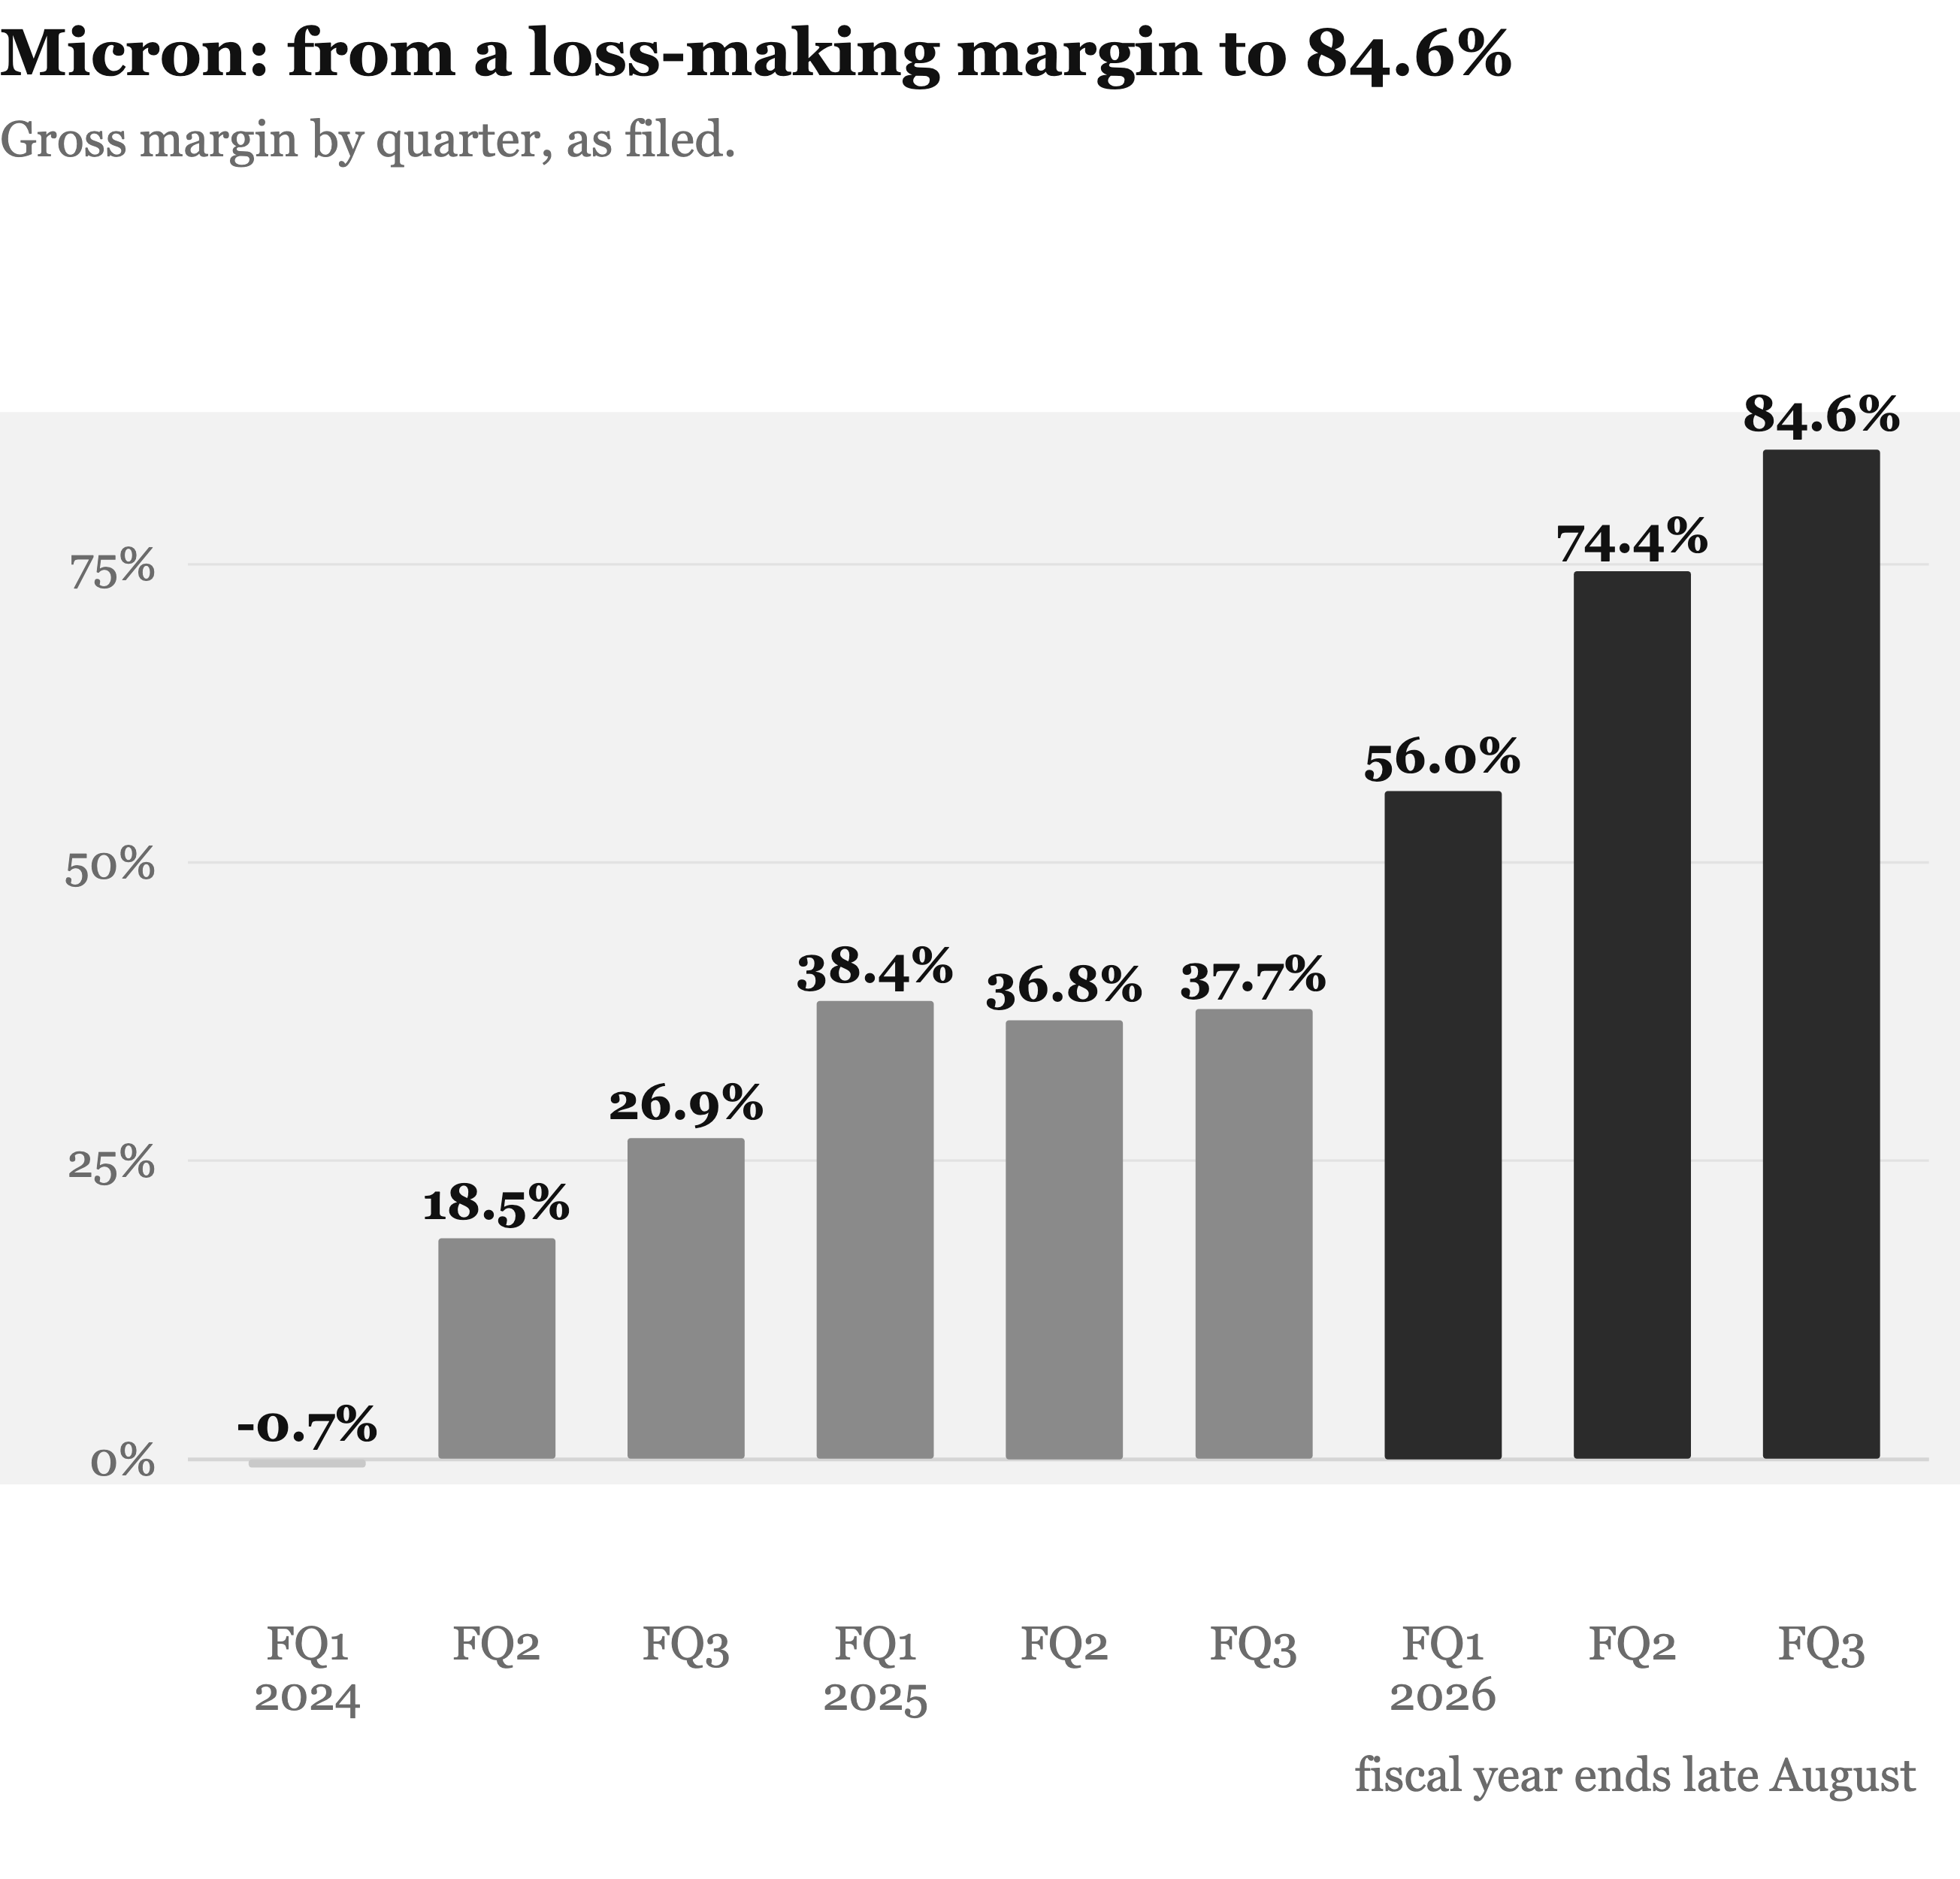
Table 7-1.
| Company | Ticker | TTM revenue | Revenue growth | Gross margin | Latest filed quarter |
|---|---|---|---|---|---|
| Sandisk | SNDK | $20.25B | +175.3% | 71.5% | 2026-07-03 |
| Applied Digital | APLD | $0.61B | +167.5% | 35.1%† | 2026-05-31 |
| Micron Technology | MU | $90.27B | +167.0% | 72.6% | 2026-05-28 |
| Credo Technology | CRDO | $1.59B | +165.1% | 67.1% | 2026-08-01 |
| CoreWeave | CRWV | $7.59B | +115.3% | 67.4%† | 2026-06-30 |
| Nvidia (benchmark) | NVDA | $302.97B | +83.4% | 74.7% | 2026-07-26 |
| Lumentum | LITE | $3.01B | +83.2% | 41.7% | 2026-06-27 |
| Super Micro Computer | SMCI | $39.06B | +77.8% | 10.8% | 2026-06-30 |
| Bloom Energy | BE | $2.43B | +58.3% | 29.8%† | 2026-03-31 |
| Teradyne | TER | $4.46B | +57.9% | 59.2% | 2026-06-28 |
| Broadcom | AVGO | $89.10B | +48.7% | 68.8% | 2026-08-02 |
| Advanced Micro Devices | AMD | $41.30B | +39.5% | 53.2% | 2026-06-27 |
| Western Digital | WDC | $12.92B | +35.7% | 48.9% | 2026-07-03 |
| Arista Networks | ANET | $10.54B | +32.6% | 63.0% | 2026-06-30 |
| Marvell Technology | MRVL | $9.45B | +30.6% | 52.2% | 2026-08-01 |
| Vertiv | VRT | $11.48B | +26.2% | 38.0%† | 2026-06-30 |
| Lam Research | LRCX | $23.23B | +26.0% | 50.5% | 2026-06-28 |
| Arm Holdings | ARM | $5.16B | +25.1% | 97.5% | 2026-06-30 |
| Coherent | COHR | $7.12B | +22.5% | 37.5%† | 2026-06-30 |
| Constellation Energy | CEG | $24.78B | +20.5% | n/a | 2026-06-30 |
| Vistra | VST | $18.98B | +18.6% | n/a | 2026-06-30 |
| Eaton | ETN | $30.02B | +15.5% | 35.9%† | 2026-06-30 |
| GE Vernova | GEV | $41.37B | +13.0% | 20.2% | 2026-06-30 |
| Applied Materials | AMAT | $30.84B | +7.8% | 49.4% | 2026-07-26 |
Table 7-2.
| Company | What it sells | Who pays | What it has guided or said |
|---|---|---|---|
| Nvidia | Accelerators, and the software to run them | Hyperscalers, nations | About 70% revenue growth for the next fiscal year |
| Micron | DRAM and NAND | Everyone above it | Tightness “through CY27 and beyond” |
| Sandisk | NAND flash, and now High Bandwidth Flash | Datacentres | Co-author of the first open HBF specification |
| Credo | Cables, optical DSPs, retimers | Cluster builders | About 85% growth; a billion-dollar quarter by early FY2028 |
| Lumentum | Optical components | Datacentre architects | Optical links becoming “a primary means of connectivity” |
| CoreWeave | Rented compute | AI labs and enterprises | “Near-term capacity remains effectively sold out” |
| Applied Digital | Buildings and power | CoreWeave | A second investment-grade tenant signed |
| Arm | Chip designs, paid by royalty | Everyone who ships a chip | Datacentre royalties more than doubled |
| Super Micro | Assembled servers | Hyperscalers | Nothing scarce to sell — 10.8% margin |
PART III — WHAT TO DO ABOUT IT
Chapter 8 compares four investors who agree on almost nothing, using their Form 13F filings for the quarter ended 30 June 2026. Cathie Wood, Stanley Druckenmiller, Philippe Laffont and Warren Buffett disclosed $368.5 billion across 367 holdings, and exactly one company appears in all four books: Alphabet. The books diverge sharply. Berkshire held $299.3 billion in twenty-six securities, with 71.86% of it in its top five — Apple at 22.04%, American Express at 17.14%, Alphabet at 12.62%, Coca-Cola and Bank of America — and reached half its book in three holdings. ARK held $15.4 billion across 189 names and needed fifteen to reach half. Coatue's largest positions were TSMC, Lam Research and Micron, while Duquesne led with Natera. Berkshire ended fourteen consecutive quarters as a net seller, buying about $19.8 billion of equities, led by Alphabet. The chapter concludes that these investors do not agree on a portfolio but on one exposure: a claim on the same handful of bottlenecks.
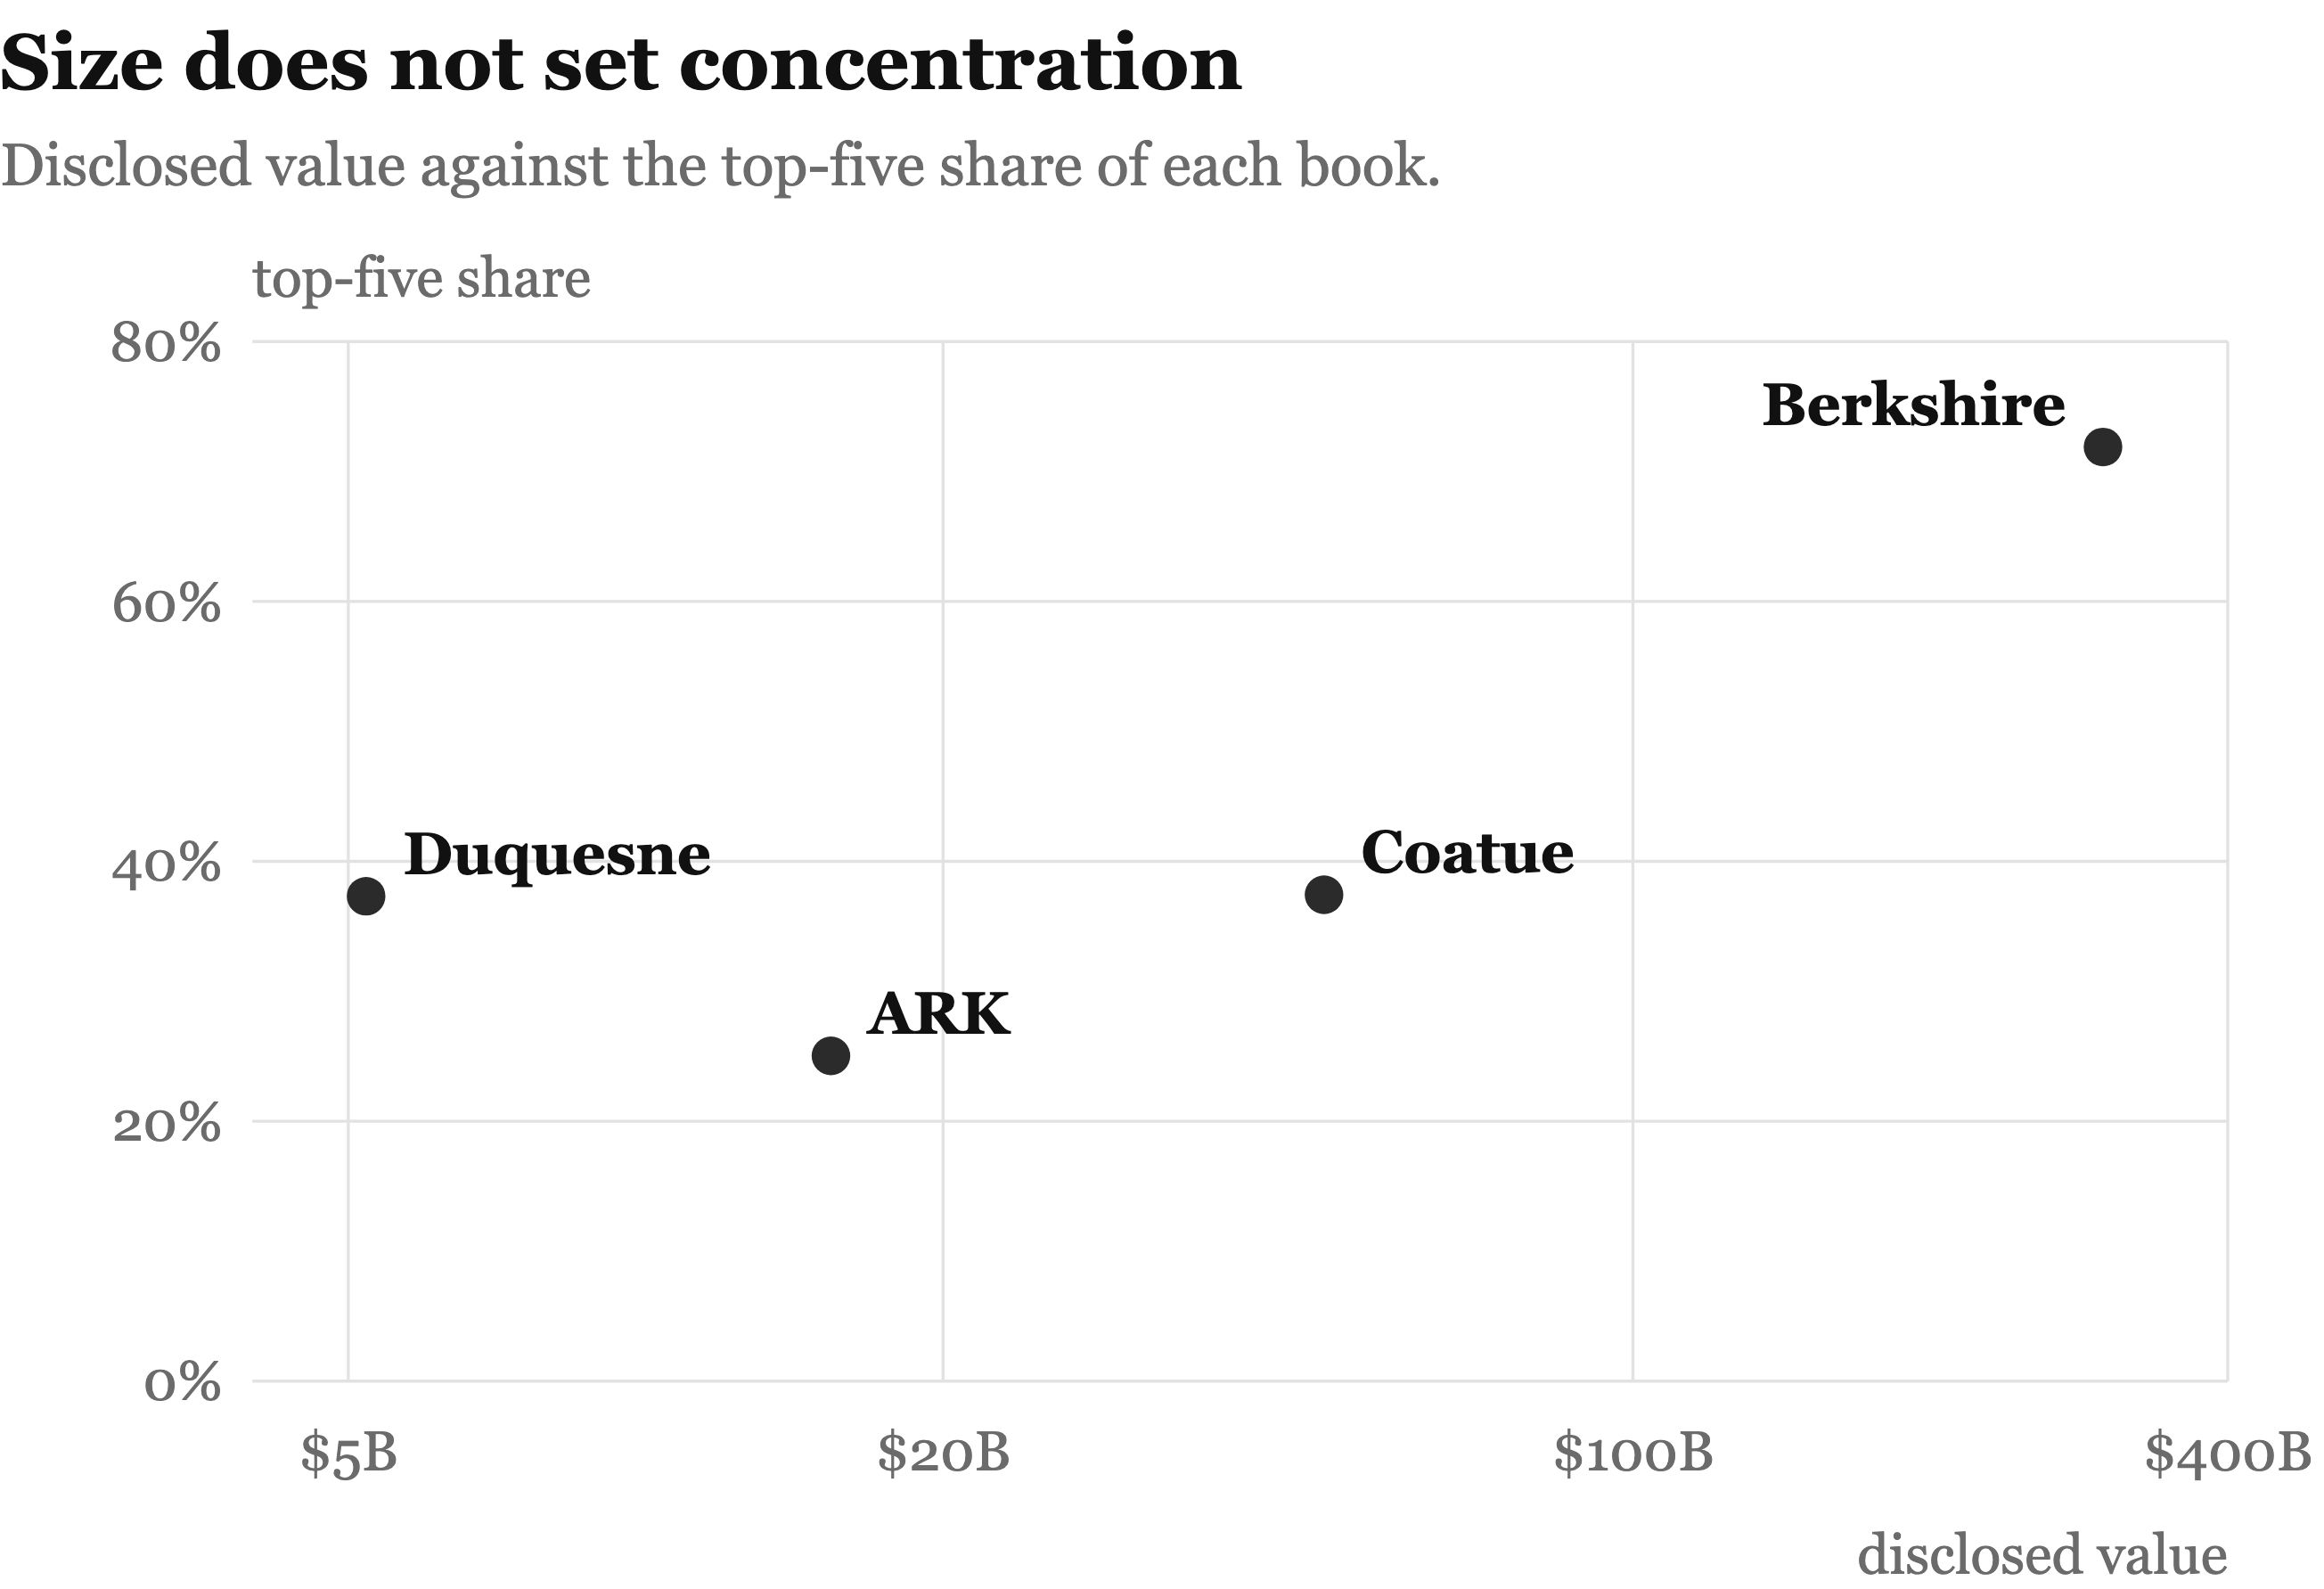
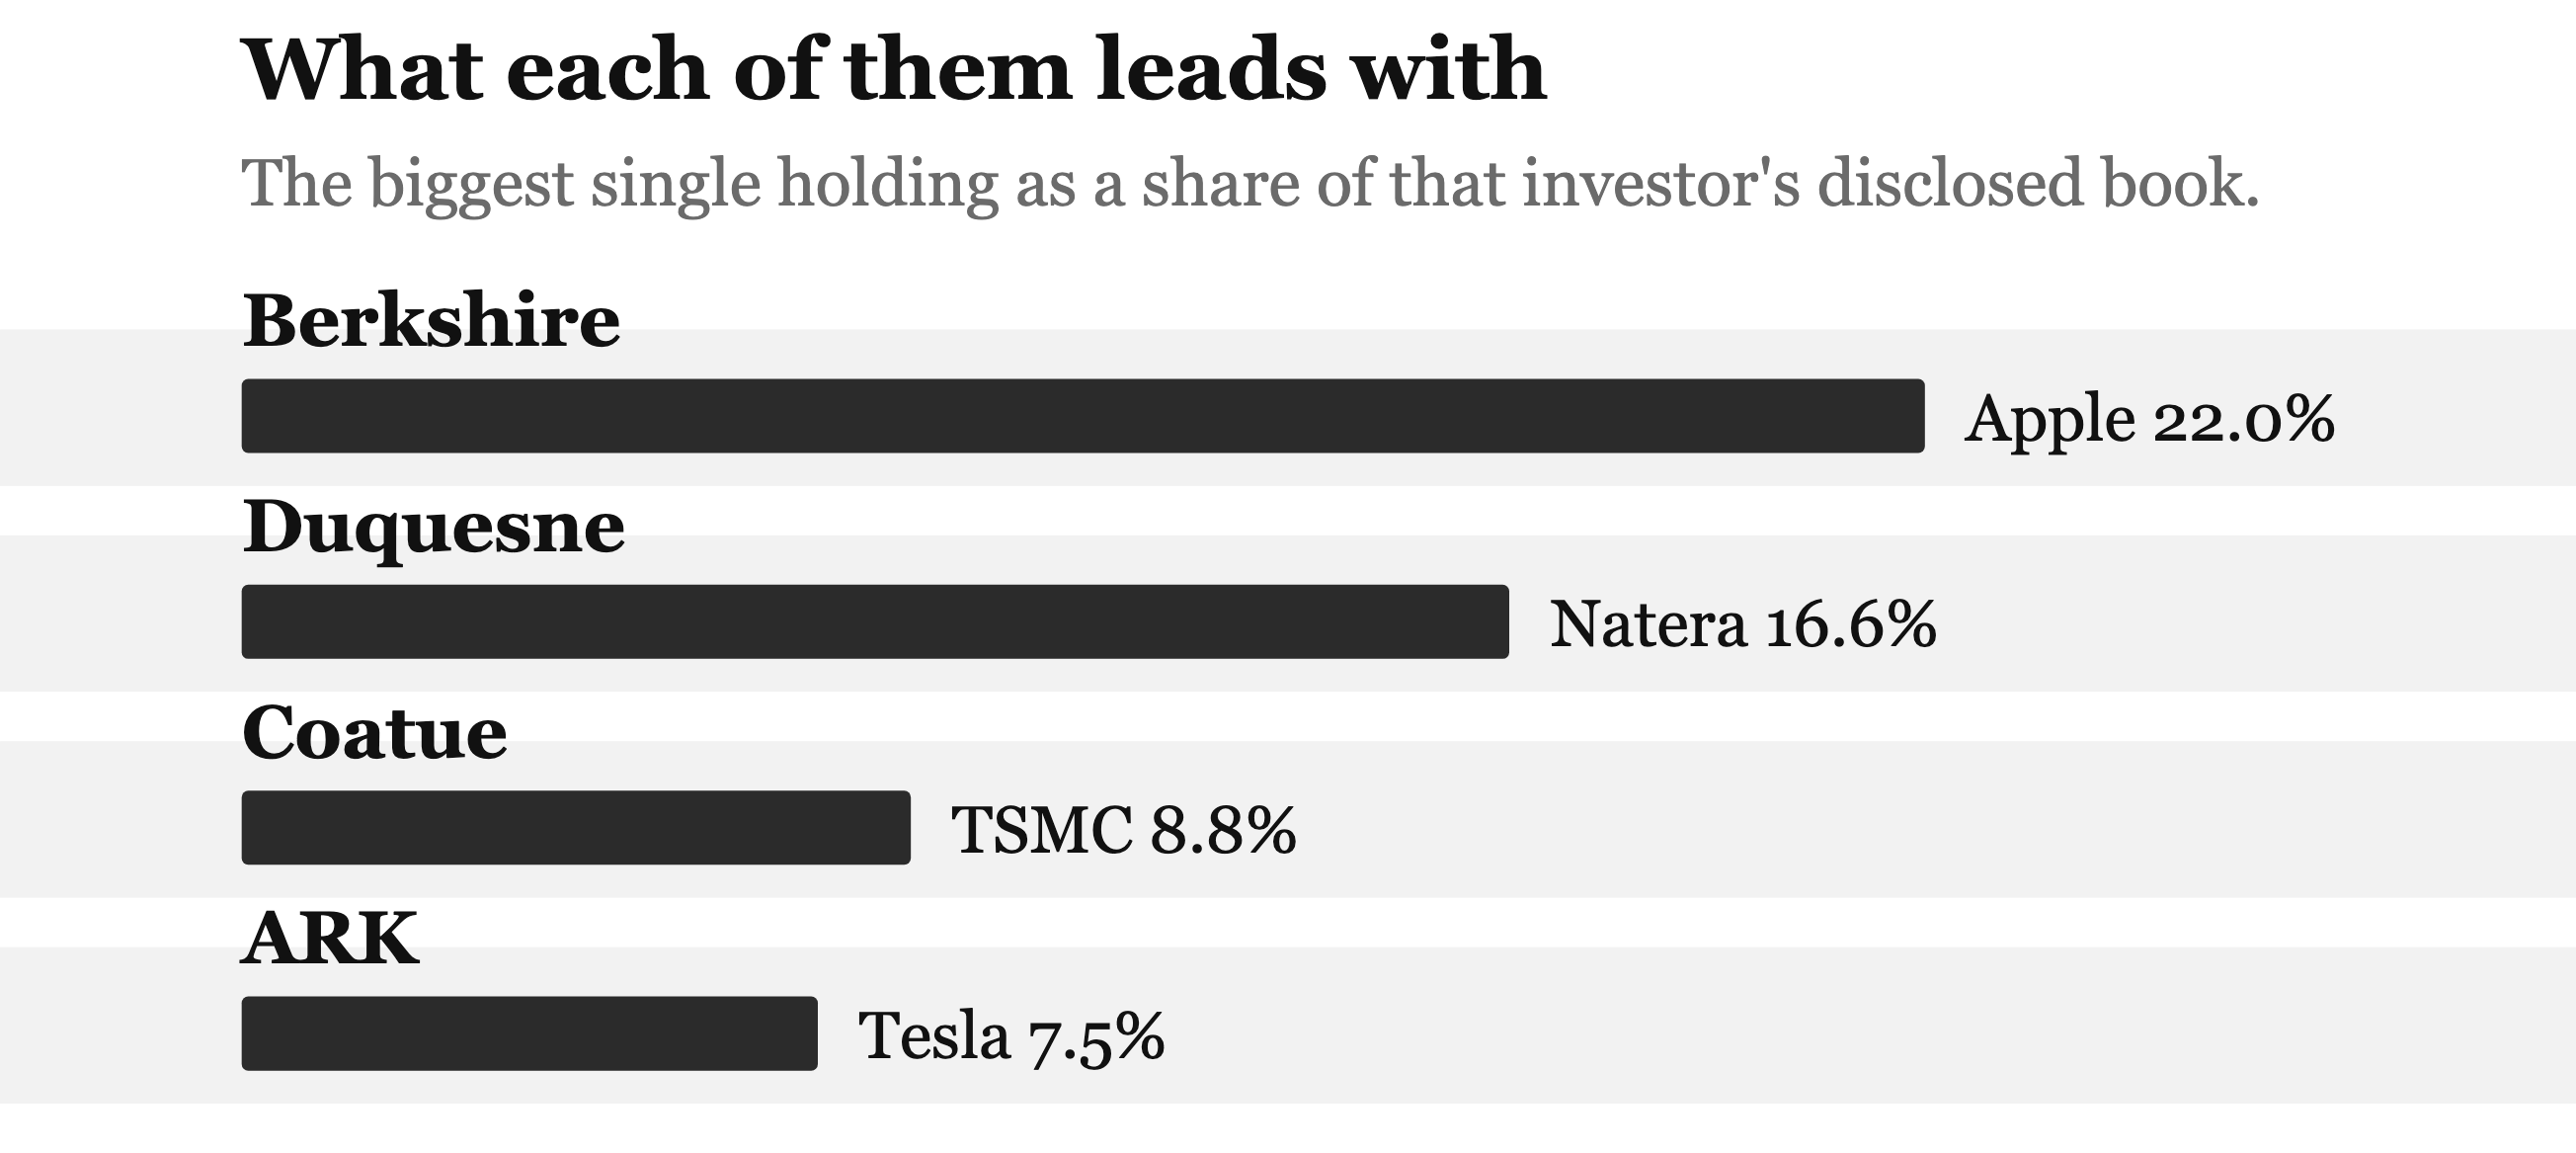
Table 8-2.
| Company | ARK | Duquesne | Coatue | Berkshire |
|---|---|---|---|---|
| Alphabet | 2.72% | 2.31% | 4.23% | 12.62% |
| Taiwan Semiconductor | 1.50% | 5.40% | 8.76% | — |
| Amazon | 2.46% | 4.58% | 5.80% | — |
| Natera | 1.21% | 16.60% | 1.40% | — |
| Meta Platforms | 0.87% | 0.54% | 2.93% | — |
| Tesla | 7.54% | 1.02% | 0.05% | — |
| Advanced Micro Devices | 5.34% | 0.81% | 0.11% | — |
Table 8-1.
| Investor | Disclosed value | Top 5 share | What the book is for |
|---|---|---|---|
| ARK Investment Management (Wood) | $15.4B | 25.02% | thematic growth, deliberately concentrated in innovation |
| Duquesne Family Office (Druckenmiller) | $5.2B | 37.33% | a macro investor's equity book |
| Coatue Management (Laffont) | $48.6B | 37.41% | technology hedge fund, heavily into AI infrastructure |
| Berkshire Hathaway (Buffett) | $299.3B | 71.86% | durable cash-generating businesses |
Chapter 9 turns to the reader's own fund. It shows the S&P 500's ten largest companies rising from about 19% of the index in 1990 to 40.7% by December 2025, with weight at 41% against an earnings share of 32%, and explains that cap weighting does the concentrating. It then reads a real Thai fund, the Eastspring SET50 RMF, at 30 June 2026: DELTA was 10.35% of it, and the ten largest holdings were 60.1% — more concentrated than the American index's top ten. The SET50's 10% cap, in force since 1 July 2025, limits DELTA, whose shares traded at 247 baht on 21 September 2026 against 116.50 baht in January 2025. The chapter notes that the S&P 500 returned 12.29% in 2026 to 18 September while its best stock rose 575% and its worst fell 64.9%. It ends with five questions to ask a fund, three defensible ways to hold this market, and the closing line: know which ones you own.
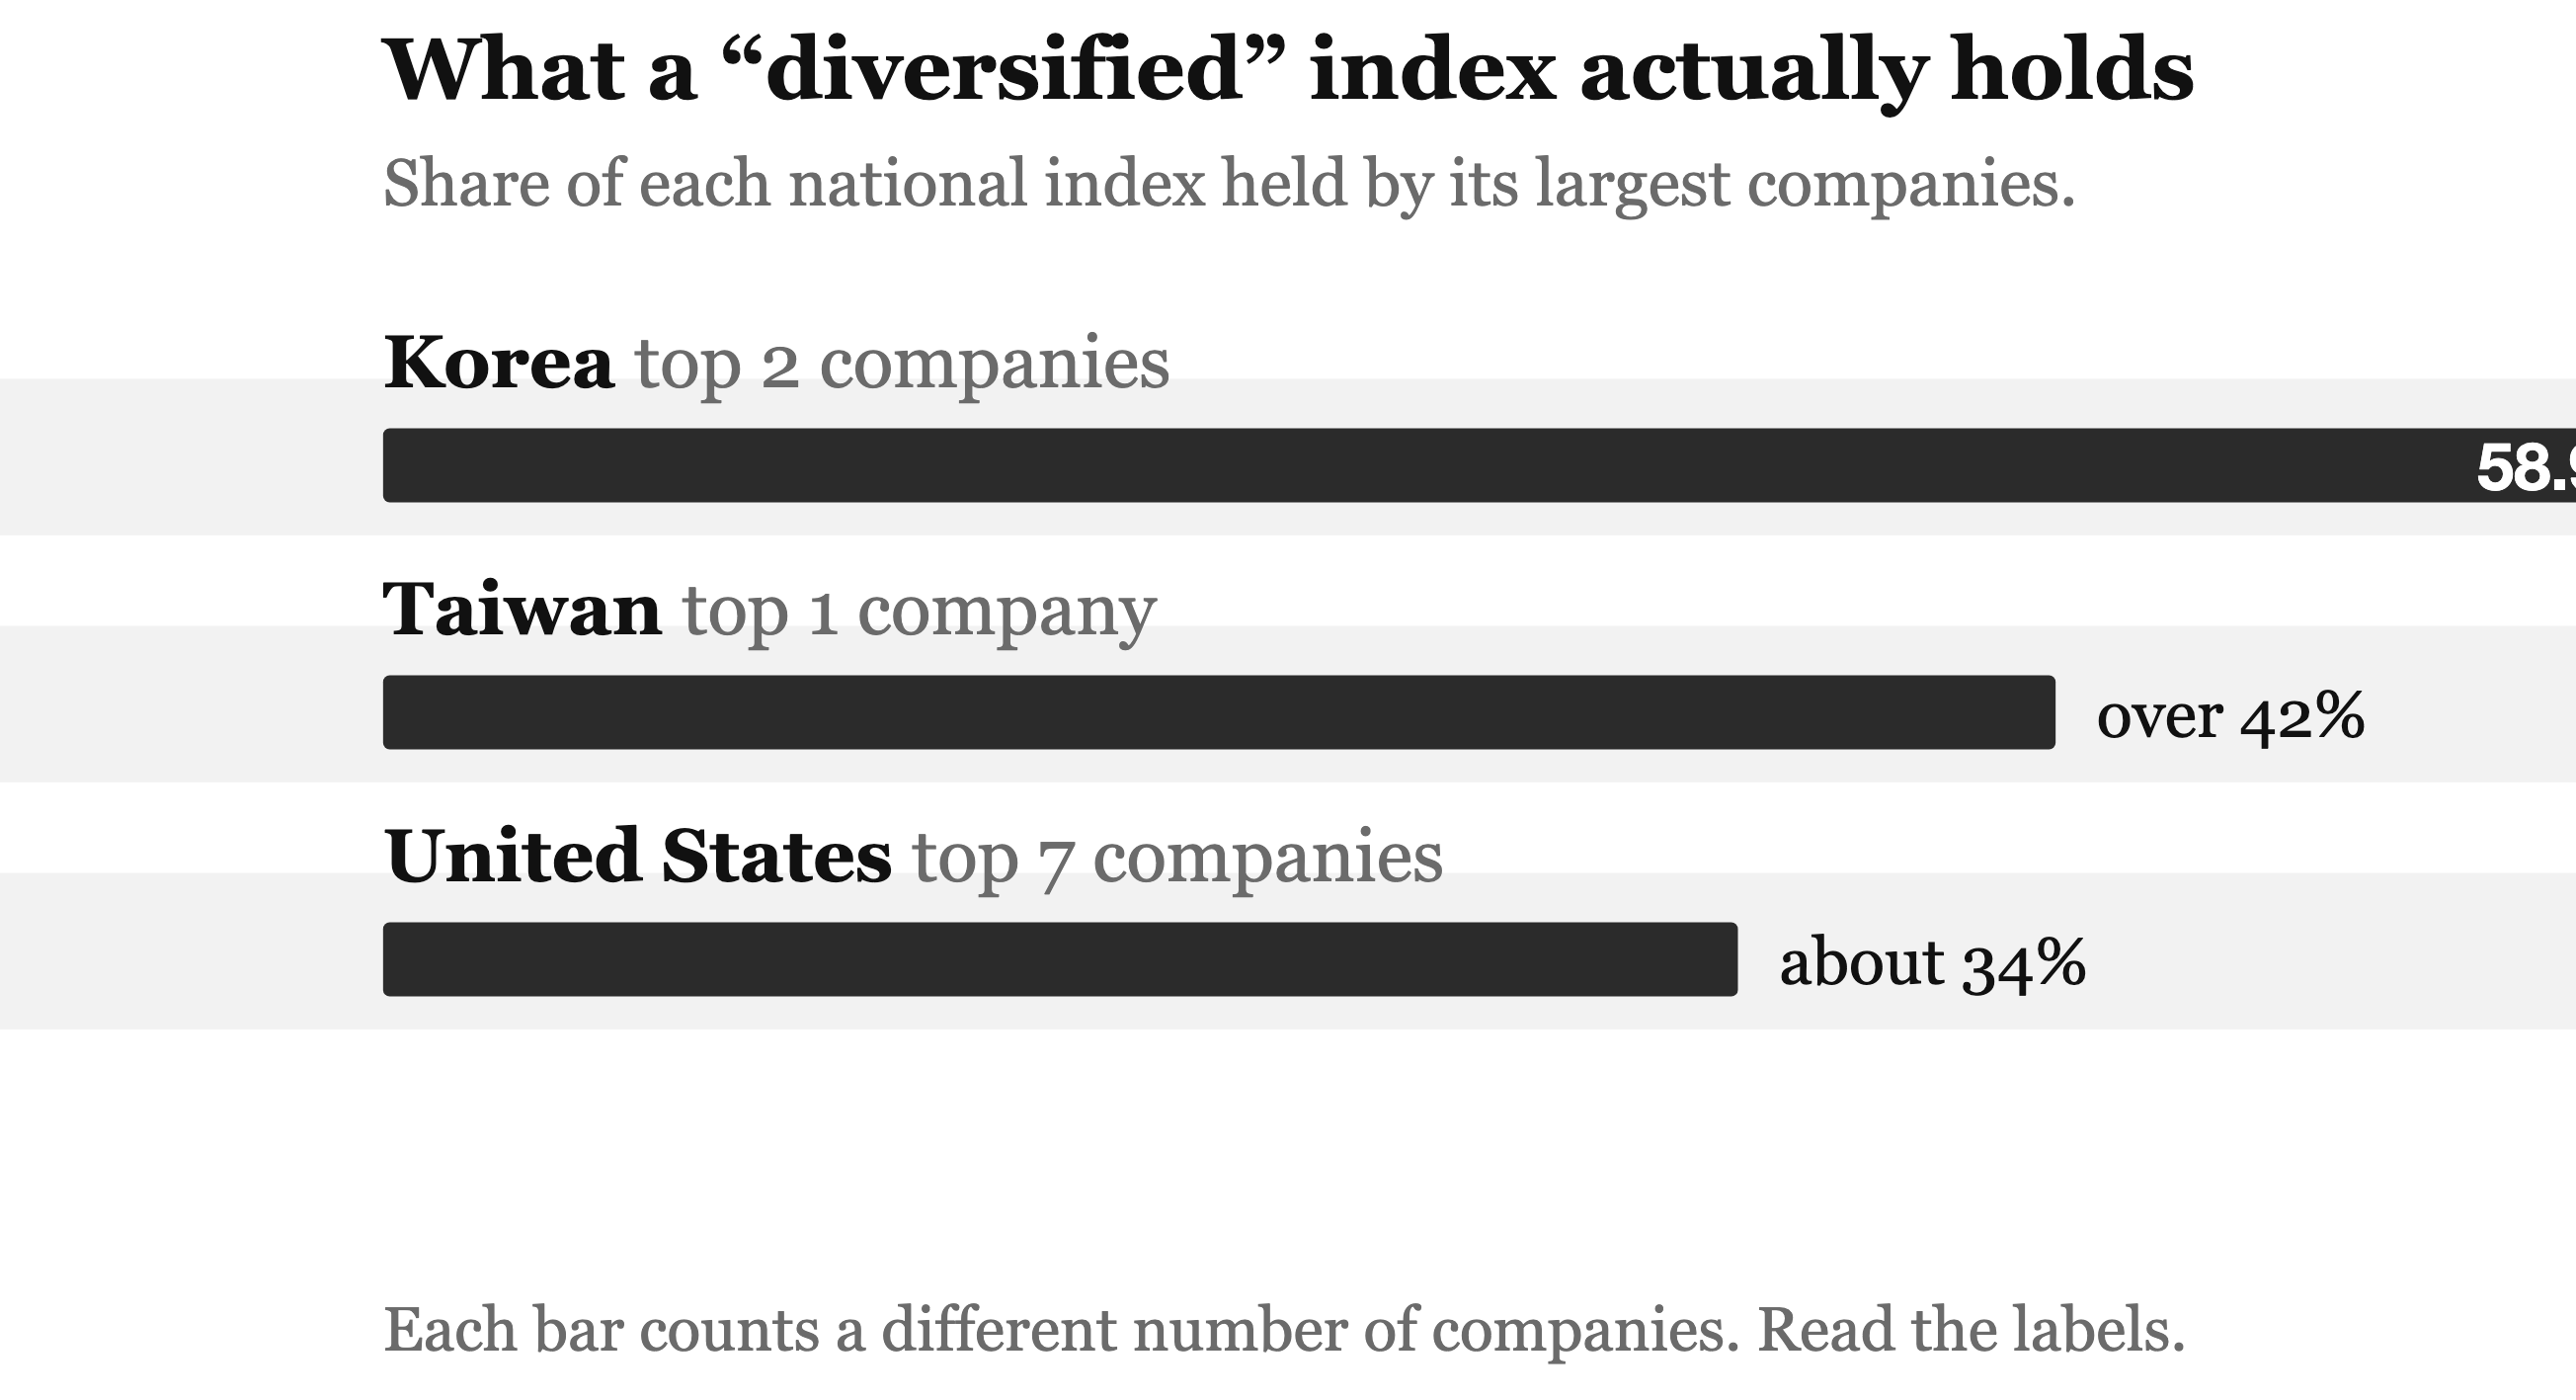
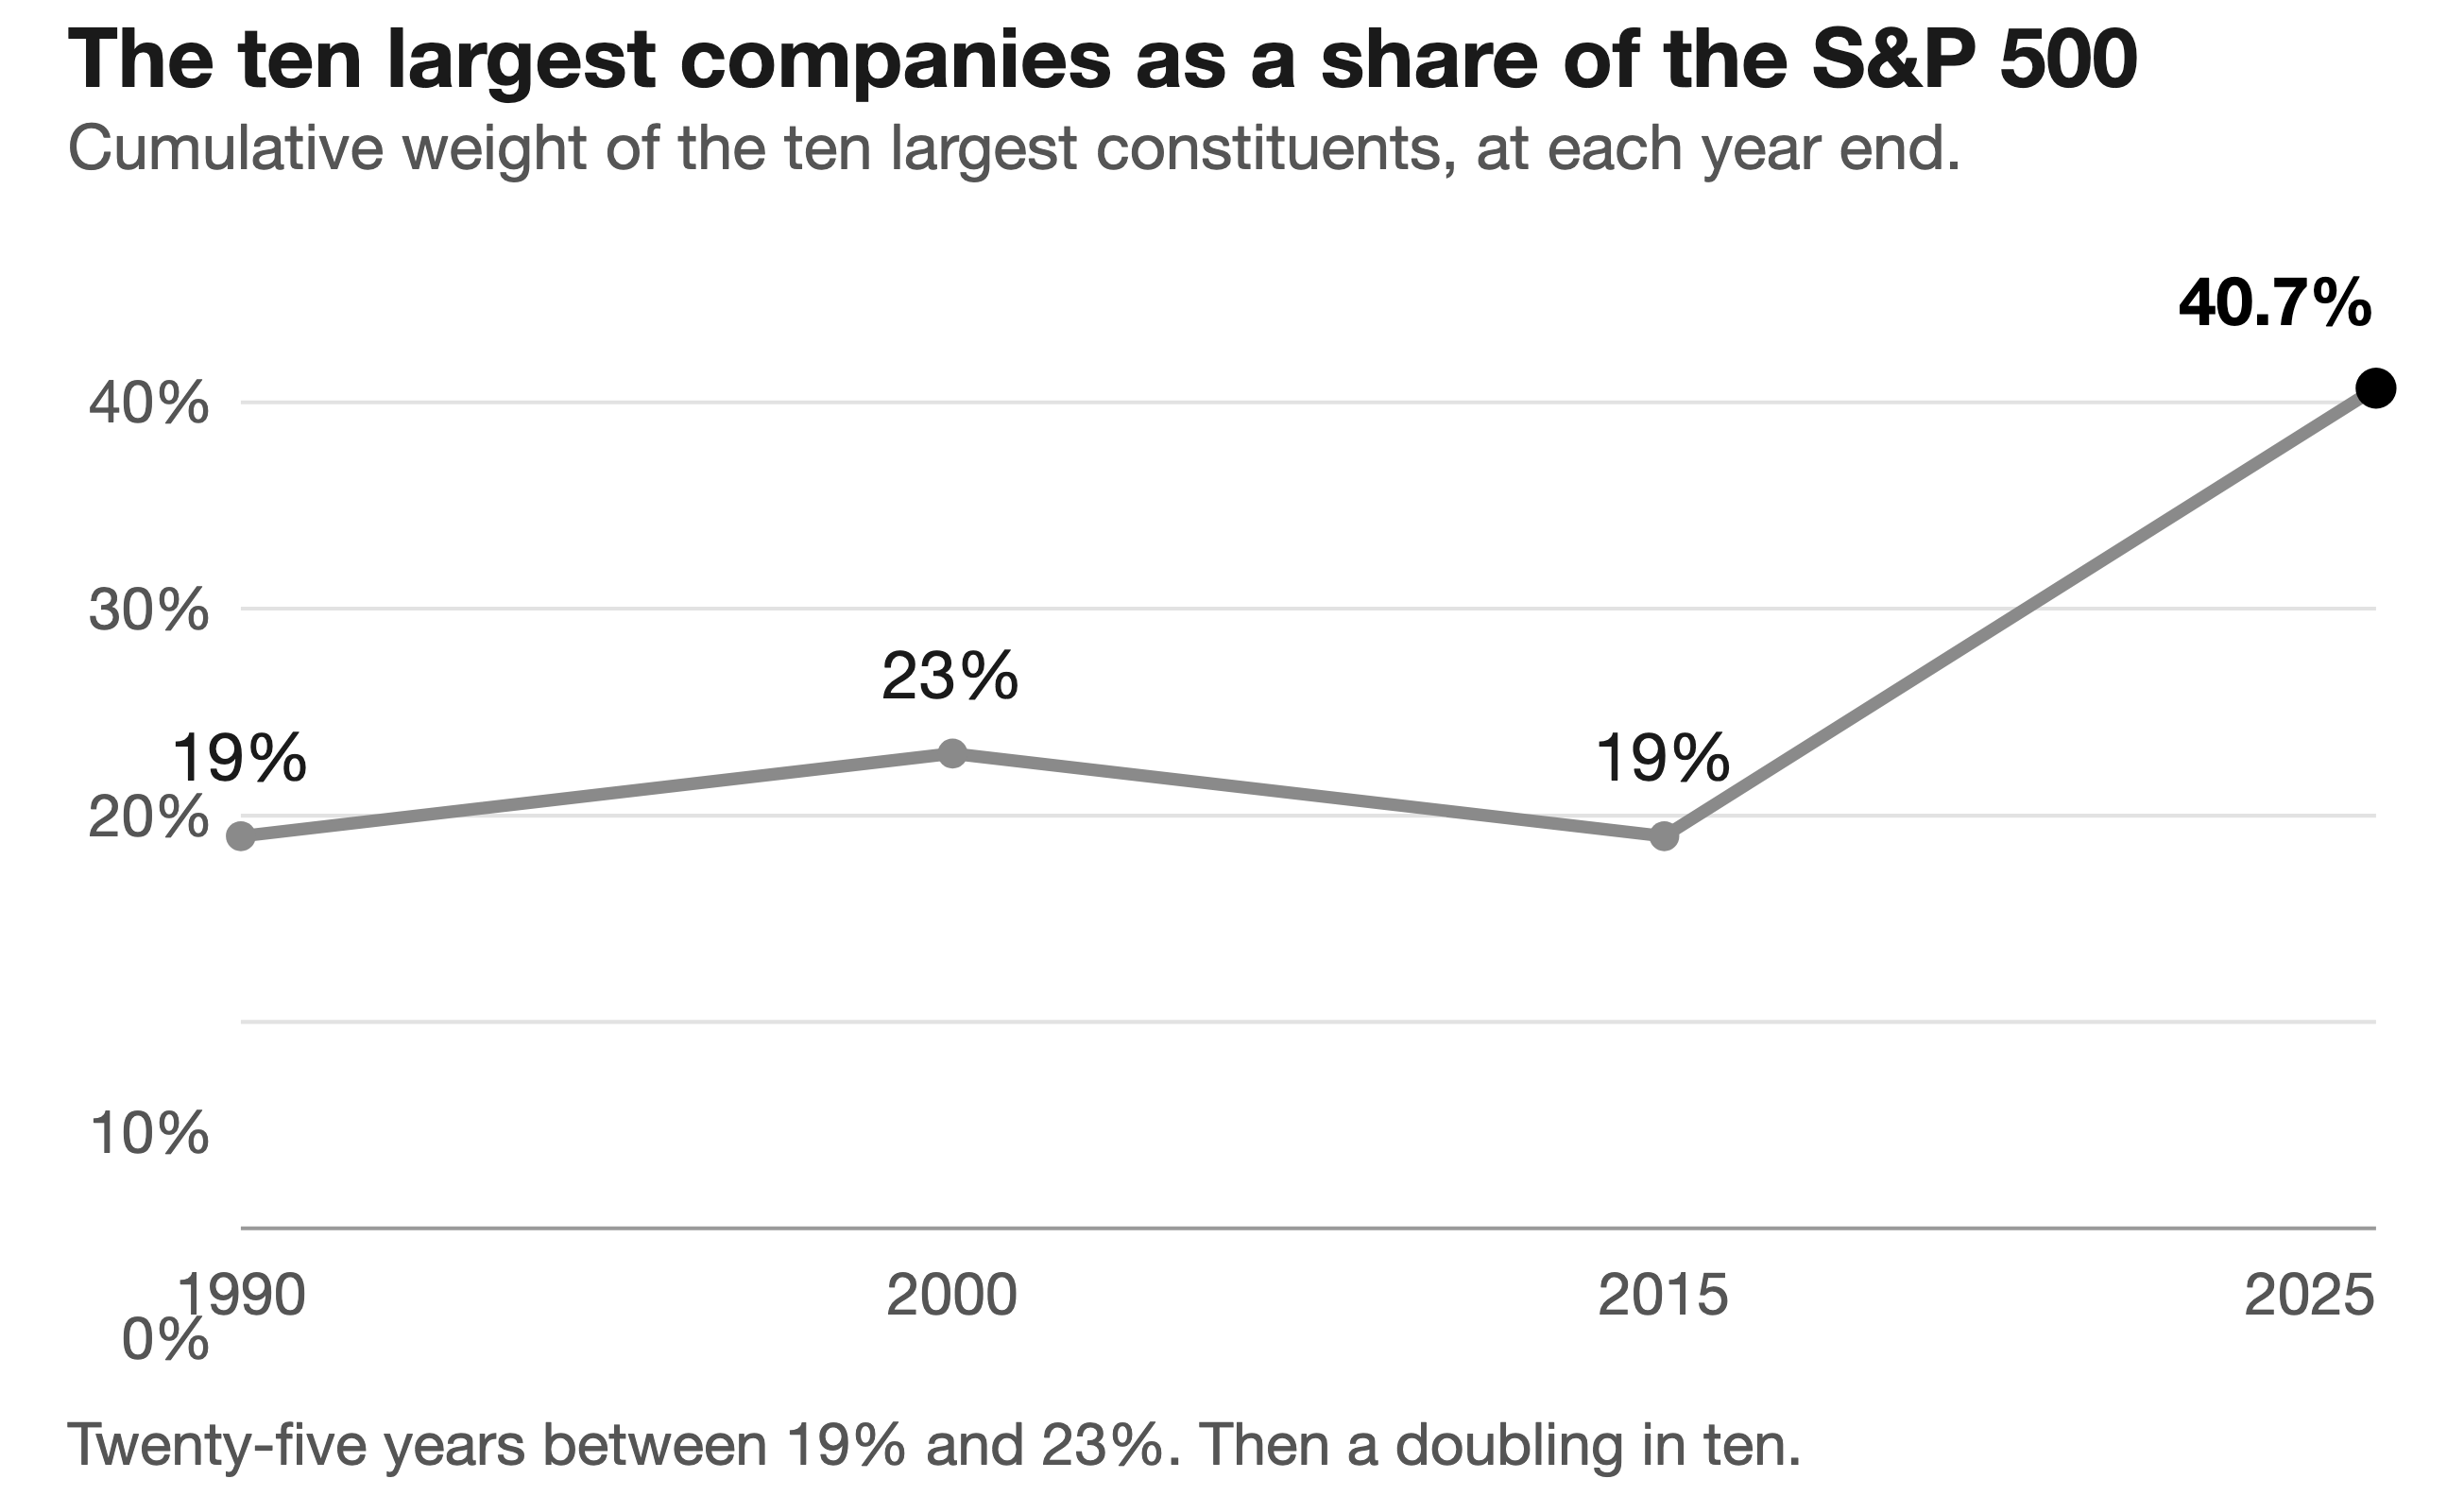
Table 9-1.
| Market | The fund claims to own | Its largest holdings | Date |
|---|---|---|---|
| United States | the S&P 500 | the seven largest companies are ~34% of it; the top ten are ~40.7% | December 2025 |
| Korea | the Korean market | two companies — Samsung and SK hynix — were 50.7%, then 55.7%, peaking at 58.9% | May–June 2026 |
| Taiwan | the Taiwanese market | one company, TSMC, above 42% | May 2026 |
| Japan | the Japanese market | Toyota still first at ¥46.1tn; Kioxia fourth and Advantest ninth — the market's new arrivals are AI suppliers | Aug–Sep 2026 |
| Thailand | the Thai market | DELTA at THB 3.44 trillion, roughly three times PTT | 7 September 2026 |
| China | the Chinese market | a memory maker, CXMT, above ICBC, at about RMB 3.3 trillion | 27 July 2026 |
Available in Kindle, paperback and hardcover. A free review copy is available to readers who would like one.
Free review copies, all six books: books.bookfunnel.com/victor-wong-review-copies