The AI super-cycle, decoded
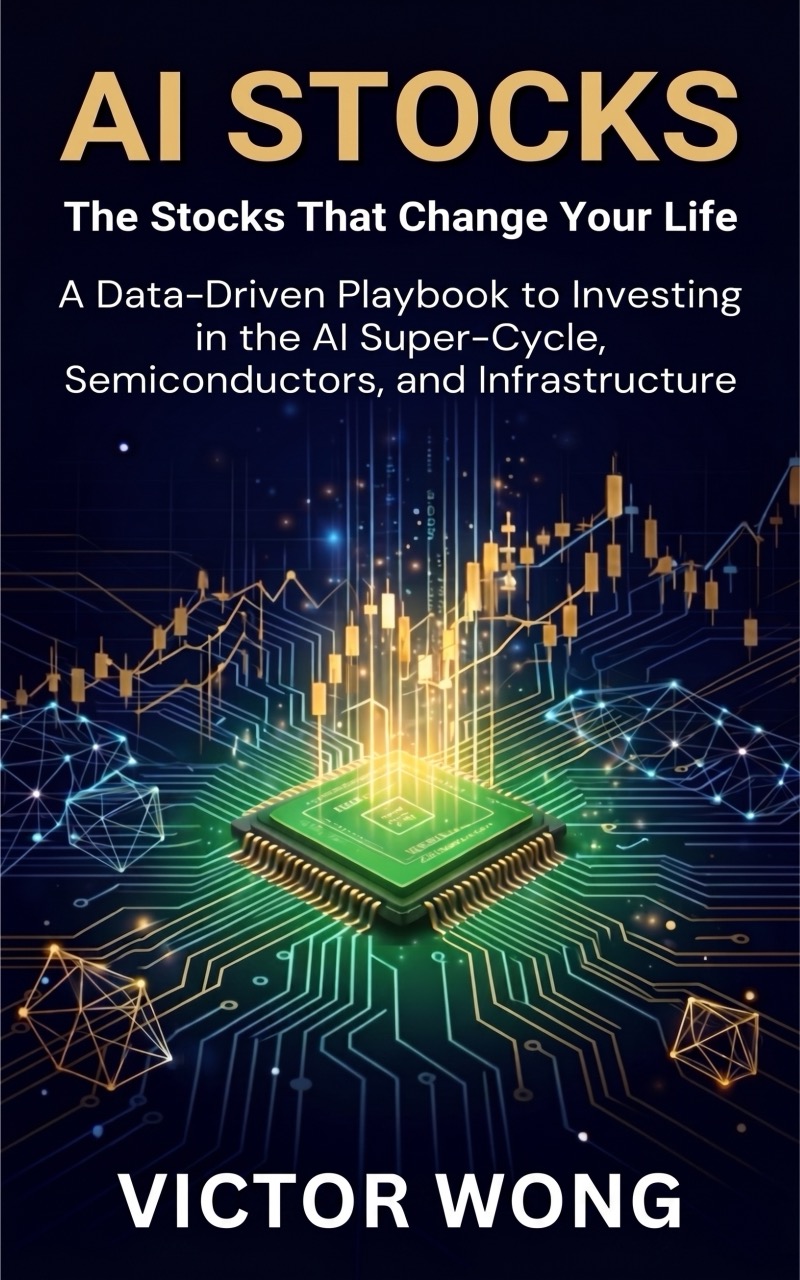
The infrastructure layer produces the safest returns. Three layers of AI investing — infrastructure, platform, application — and four portfolio models from $500 to $500,000.
What each chapter argues, in order, with the figures it uses. From chapter 1 to the last page.
The opening chapter frames the AI boom as the fastest technological shift in human history and sets up the book's investing case. It traces three revolutions: the Industrial Revolution (James Watt's 1765 engine burned 75% less coal; UK GDP per capita rose from £1,750 in 1760 to £3,000 by 1840), the Internet era, and AI. It cites world GDP per capita staying nearly flat for over 1,700 years in the Malthusian Trap, then shows adoption accelerating from the telephone's 75 years to 50 million users down to ChatGPT's single month. OpenAI launched ChatGPT on November 30, 2022; it reached 100 million users in about two months. The chapter also notes NVIDIA's FY2024 revenue of $130.5 billion and every past revolution's bubble (the 1845 Railway Mania, the 2000 dot-com crash that cut the Nasdaq 78%). Six lessons follow, including buying "pick and shovel" infrastructure, respecting bubbles without avoiding them, and acting before feeling ready. The takeaway: AI changes brain-based professions, and the U.S. hosts 7 of the world's top 10 tech companies.
| Year | Event | Users (Millions) |
|---|---|---|
| 1969 | ARPANET — the beginning | 4 universities |
| 1983 | TCP/IP becomes the standard | A few thousand |
| 1989 | Tim Berners-Lee invents the World Wide Web | Zero |
| 1993 | Mosaic — first graphical browser | ~1 |
| 1995 | Amazon, eBay, Yahoo founded | 16 |
| 1997 | Amazon IPO ($18/share) | 75 |
| 1998 | Google is born | 150 |
| 2000 | Dot-com Bubble peaks, then crashes | ~400 |
| 2004 | Facebook launches; Google IPO ($85/share) | ~850 |
| 2005 | YouTube launches | 1,000 (1B) |
| 2007 | iPhone launches — the Internet goes mobile | ~1,500 |
| 2010 | Instagram, cloud computing takes off | ~2,000 |
| 2015 | Mobile-first world | ~3,200 |
| Year | Event | Impact |
|---|---|---|
| 1712 | Thomas Newcomen builds the first commercial steam engine | Pumps water from coal mines, but guzzles fuel |
| 1765 | James Watt adds a separate condenser | Burns 75% less coal — now it's commercially viable |
| 1775 | Watt partners with Matthew Boulton to form a company | Mass production of steam engines begins |
| 1780s | Cotton mills powered by steam for the first time | Fabric production speeds up 10–20x |
| 1790s | Cheap steel (Henry Cort's puddling process) | Bridges, railroads, and tall buildings become possible |
| 1804 | First steam locomotive (Richard Trevithick) | Goods move 5x faster than by horse |
| 1825 | Stockton–Darlington Railway — world's first passenger railway | Humans travel faster than ever in history |
| 1830 | Liverpool–Manchester Railway opens | Mass transit begins |
| 1840s | Industrial Revolution spreads to Europe and America | Textile mills in New England, steel in Pennsylvania |
This chapter gives a framework for investing in AI through three layers, using a Gold Rush analogy: selling picks and shovels (Infrastructure, lower risk), running a store in town (Platform), and digging for gold (Application, highest risk). The Infrastructure layer centers on NVIDIA, founded in 1993, whose CUDA platform (launched 2006) and roughly 80% AI-accelerator share produced $215.9 billion in fiscal 2026 revenue; TSMC controls 71% of the foundry market. The Platform layer pits Microsoft, Google, and Amazon, where cloud hit $129 billion per quarter in Q1 2026 and Microsoft's $1 billion OpenAI bet in 2019 grew past $13 billion, with Anthropic valued at about $965 billion versus OpenAI's ~$852 billion. The Application layer warns against thin "wrapper" startups. The chapter recommends ETFs, starting with QQQ at 0.20%, and suggests an allocation of 60% Infrastructure, 25% Platform, 10% Application, and 5% cash. The takeaway: choose the layer that matches your risk tolerance and time.
| ETF | Focus | Expense Ratio | Layer | Best For |
|---|---|---|---|---|
| QQQ 🥇 | Nasdaq 100 — AI + all big tech | 0.20% | All Layers | Beginners — start here |
| SMH | Semiconductor (NVIDIA, TSMC, Broadcom) | 0.35% | Layer 1 | If you believe in infrastructure |
| SOXX | Semiconductor (broader than SMH) | 0.35% | Layer 1 | Alternative to SMH |
| IGV | Software & tech companies | 0.41% | Layer 2+3 | Platform + Application exposure |
| BOTZ | Robotics + AI | 0.68% | Layer 2+3 | AI + robotics theme |
| AIQ | Broad AI — every layer | 0.68% | All Layers | Full AI exposure in one ticker |
| CHAT | Generative AI | 0.75% | Layer 3 | Pure-play generative AI |
| QTUM | Quantum computing + AI | 0.40% | Layer 1 | Quantum + AI infrastructure |
| Stock | Role in AI | Why It Matters |
|---|---|---|
| Broadcom (AVGO) 🥇 | Networking chips for AI data centers | "The nervous system of AI" — every data center needs its chips |
| Vertiv (VRT) | Power and cooling systems | Every data center needs cooling — and Vertiv is the market leader |
| Equinix (EQIX) | Data center REIT #1 | Owns the physical real estate where AI runs — plus a solid dividend |
| Digital Realty (DLR) | Data center REIT | Same story as Equinix — pure play on data center demand |
| AMD (AMD) | GPU/CPU alternative to NVIDIA | The #2 player — gaining ground with MI300/MI400 series |
| Arm Holdings (ARM) | CPU architecture for AI | Power-efficient chips designed into everything from phones to servers |
This chapter profiles individual AI stocks in four dimensions — business, numbers, risks, and playbook. NVIDIA, born in 1993, posted $215.9 billion in FY2026 revenue and about $193.7 billion in data-center sales, defended by CUDA and roughly 80-90% accelerator share. TSMC, founded in 1987 by Dr. Morris Chang, holds 71% foundry share but carries Taiwan risk. Microsoft, led by Satya Nadella since 2014, runs a $37+ billion AI business; Alphabet launched Gemini after a "Code Red" and hit $20 billion in quarterly Google Cloud revenue; Amazon leads cloud with 28% share and invested in Anthropic. Broadcom supplies networking chips and AMD's MI400 series was projected at ~$7.2 billion in 2026. Beyond the giants, it covers Vertiv, Palantir (~$3.5 billion run rate), and CrowdStrike (~$5 billion). It offers beginner, intermediate, and aggressive sample portfolios and a glossary on CUDA, lock-in, and five-year horizons. The takeaway: match conviction to a 5-year minimum horizon and diversify.
| Stock | Layer | Revenue | Growth | Moat | Risk | Rating |
|---|---|---|---|---|---|---|
| NVIDIA 🥇 | Infra | $215.9B | +65% | CUDA + HW | Geopolitical | ⭐⭐⭐ |
| TSMC 🥈 | Infra | >$100B | ~30% | 71% share | Taiwan risk | ⭐⭐⭐ |
| Microsoft | Platform | $82.9B/Q | +18% | Enterprise lock-in | Antitrust | ⭐⭐⭐ |
| Platform | $20B/Q (Cloud) | +63% | TPU + Data | Antitrust | ⭐⭐ | |
| Amazon | Platform | AWS #1 | Steady | Ecosystem | Share erosion | ⭐⭐ |
| Broadcom | Infra | >$50B | Strong | Networking dominance | P/E | ⭐⭐ |
| AMD | Infra | ~$25B | Growing | CPU + GPU | Share gap | ⭐⭐ |
| Metric | Number |
|---|---|
| FY2026 Total Revenue | $215.9B (+65% YoY) |
| FY2026 Data Center Revenue | ~$193.7B |
| Q1 FY2027 (latest) | $81.6B (+20% QoQ, +85% YoY) |
| AI Accelerator Market Share | ~80–90% (vs AMD ~10%) |
| Next Platform | Vera Rubin (Vera CPU + Rubin GPU) — partners start H2 2026 |
This chapter teaches how to monitor AI stocks without staring at charts, opening with the Gold Rush stories of Samuel Brannan and Levi Strauss to reinforce the infrastructure thesis. It builds an investor calendar around NVIDIA earnings — the "Super Bowl of AI" — noting that in February 2024 NVIDIA reported $18.4 billion in data-center revenue, up 409% year-over-year, and surged 16% the next day, adding about $277 billion in market cap. It then defines five KPIs: AI revenue run rate (contrasting Stability AI's ~$8-11 million 2023 revenue against ~$153 million in expenses), CapEx, NVIDIA gross margin (64.9% in FY2022, ~75% in FY2025, 71.1% in FY2026), adoption (900 million weekly ChatGPT users), and patent counts. Sell signals and green signals follow, along with a 30-minute weekly routine and a review of NVIDIA's past corrections (down 66% in 2022). The takeaway: buy infrastructure, expect corrections, and never go all-in on one theme.
| Timing | Event | What to Watch |
|---|---|---|
| Mid Feb | NVIDIA Q4 Earnings | Data Center revenue, Gross Margin, Guidance |
| Mid Apr | NVIDIA Q1 Earnings | YoY growth — accelerating or decelerating? |
| Mid Aug | NVIDIA Q2 Earnings | Data Center revenue vs. estimates |
| Mid Nov | NVIDIA Q3 Earnings | Outlook for next year + Vera Rubin updates |
| Every Quarter | Microsoft, Google, Amazon Earnings | AI Revenue Run Rate, CapEx spending |
| Every Quarter | Vertiv, Equinix, Broadcom Earnings | Data center buildout trajectory |
KPI #3: NVIDIA Gross Margin — The Mother of All AI Metrics
Chart drawn from the table below, using the book’s own figures.
| Fiscal Year | Gross Margin | The Story |
|---|---|---|
| FY2022 | 64.9% | Baseline before AI boom |
| FY2023 | 56.9% | ⚠️ Panic! — Inventory write-down (gaming slump + crypto crash) |
| FY2024 | 72.7% | 🟢 AI chip demand surged — NVIDIA gained pricing power |
| FY2025 | ~75% | 👑 Highest in company history |
| FY2026 | 71.1% | Vera Rubin ramping — margins slightly normalized |
This chapter argues AI agents — systems that take a goal and act autonomously — are the next phase, distinct from ChatGPT's question-and-answer model. It cites Cognition Labs' Devin (March 2024), which scored about 14% on the SWE-bench benchmark versus under 2% for prior systems, and Anthropic's Claude Code in 2025; by 2026 an estimated 30%+ of software companies use agents for mid-level engineering work. It projects the AI-agent market growing from $7.84 billion in 2025 to $52.62 billion by 2030 (MarketsandMarkets) and notes Goldman Sachs forecasting a 24x rise in token consumption by 2030. Stocks covered include NVIDIA's Vera Rubin platform, TSMC, Broadcom, Vertiv, and Equinix, plus service-software names under pressure: ServiceNow fell ~33% and Palantir ~23% in 2026. It gives real examples at JPMorgan (agents handling ~30% of inbound calls), UnitedHealth, and Walmart, then a 2026-2030 milestone timeline. The takeaway: infrastructure benefits most as agents multiply compute, power, and cooling demand.
| Year | Key Milestone |
|---|---|
| 2026 | Vera Rubin enters production. AI agents adopted by large enterprises |
| 2027 | AI agents become widespread — operational costs drop 30–50% |
| 2028 | AI agents begin replacing mid-level management functions |
| 2029 | Token consumption approaches +24x (vs. 2026 baseline) |
| 2030 | AI agent market >$50B — virtually every Fortune 500 company uses them |
| ETF | Expense Ratio | Layer | Best For |
|---|---|---|---|
| QQQ 🥇 | 0.20% | All Layers | Beginners — start here |
| SMH | 0.35% | Layer 1 | Believe in infrastructure (chips) |
| AIQ | 0.68% | All Layers | Full AI exposure |
| BOTZ | 0.68% | 2+3 | AI + Robotics |
| CHAT | 0.75% | Layer 3 | Generative AI focus |
This chapter frames a winner-take-most battle between Microsoft, Google, and Amazon, together worth over $10 trillion and spending more than $550 billion in combined 2026 CapEx ($700 billion including Meta). The cloud market reached $129 billion per quarter in Q1 2026, split among AWS (28-31%), Azure (21-24%), and Google Cloud (12-16%). Microsoft's history runs from buying QDOS for $50,000 in 1980, to the 1998 antitrust case, to Nadella's 2019 $1 billion OpenAI investment that grew past $13 billion and a $37+ billion AI run rate. Google's story covers the Transformer paper (2017), the $500 million DeepMind acquisition, AlphaGo's 2016 win, the "Code Red," and the "Google Graveyard" trust problem; Google Cloud hit $20 billion (+63%) with a $460 billion backlog. Amazon's covers Bezos' regret framework, AWS's 2006 launch, the $170 million Fire Phone failure, and its Anthropic bet (~$965 billion). The takeaway: Microsoft is the safest, Google the cheapest, Amazon the most diversified — but infrastructure wins regardless.
| Year | Microsoft | Amazon | |
|---|---|---|---|
| 1985 | DOS creates empire | — | — |
| 1994 | Windows 95 | — | Bezos launches Amazon |
| 1998 | Antitrust trial | Page & Brin found Google | IPO |
| 2002 | — | Turns down Yahoo's $3B offer | — |
| 2006 | Vista flops | Acquires YouTube | AWS launches |
| 2014 | Nadella becomes CEO | Acquires DeepMind $500M | Fire Phone fails |
| 2016 | — | AlphaGo beats Lee Sedol | Echo/Alexa launch |
| 2019 | Invests $1B in OpenAI | — | — |
| 2022 | ChatGPT launches | "Code Red" declared | — |
| 2024 | AI Revenue $37B+ | Gemini + TPU | Invests $4B in Anthropic |
| 2026 | Copilot: 400M users | Google Cloud $20B/Q (+63%) | Anthropic valued $965B |
| Dimension | Microsoft 🥇 | Google 🥈 | Amazon 🥉 |
|---|---|---|---|
| AI Technology | ⭐⭐⭐ (GPT-5.5) | ⭐⭐⭐ (Gemini 3 + TPU) | ⭐⭐ (Claude via Anthropic) |
| Enterprise Trust | ⭐⭐⭐ | ⭐⭐ (Google Graveyard) | ⭐⭐⭐ |
| Cloud Market Share | 21-24% | 12-16% | 28-31% |
| AI Revenue Clarity | ⭐⭐⭐ $37B+ | ⭐⭐ Not clearly broken out | ⭐⭐ AWS AI services |
| CapEx 2026 | ~$190B | ~$175-190B | ~$200B |
| Valuation (P/E) | ~35x | ~25x (cheapest) | ~40x |
| Consumer AI | ⭐⭐⭐ ChatGPT integration | ⭐⭐⭐ Gemini | ⭐ None |
| Biggest Risk | Antitrust | Enterprise Trust | No consumer AI |
This chapter supplies a systematic framework for judging AI stocks, warning that most 2024 buyers will lose money by 2030 because transformative technology and profitable investing are different things. It teaches five metrics — price-to-earnings, price-to-sales, the PEG ratio, free-cash-flow yield, and gross margin — each with interpretation ranges, applied to a comparison table of NVIDIA, Microsoft, Alphabet, TSMC, and Amazon. It then presents three mental models: Peter Lynch's PEG ratio and "buy what you know," Warren Buffett's economic moat (ecosystem lock-in, data network effects, scale, switching costs), and Benjamin Graham's margin of safety. Five common traps are dissected, including the "this time is different" fallacy, loving the technology, ignoring capital expenditure, confusing revenue with profit, and overestimating your ability to pick winners. A ten-point pre-purchase checklist follows, closing with Isaac Newton's South Sea Bubble loss of £20,000. The takeaway: use process and discipline, not CNBC or Reddit, and never evaluate an AI stock on P/E alone.
| P/S Ratio Range | What It Tells You |
|---|---|
| 1–3 | Reasonable / potentially undervalued |
| 3–8 | Growth priced in |
| 8–15 | Rich — needs excellent growth to justify |
| 15–30 | Speculative territory |
| 30+ | Pricing in perfection — any miss will hurt |
| Company | Ticker | P/E (TTM) | P/S | PEG (1yr fwd) | Gross Margin | FCF Yield | AI Moat |
|---|---|---|---|---|---|---|---|
| NVIDIA | NVDA | ~50–60 | ~25 | ~1.5 | 72–75% | ~1% | GPUs + CUDA ecosystem |
| Microsoft | MSFT | ~33–37 | ~11 | ~2.0 | 68–70% | ~2.5% | OpenAI partnership, Azure AI |
| Alphabet | GOOGL | ~23–27 | ~6 | ~1.5 | 55–58% | ~3.5% | DeepMind, TPU, massive data |
| TSMC | TSM | ~20–25 | ~8 | ~1.2 | 50–53% | ~3% | Manufacturing monopoly for advanced chips |
| Amazon | AMZN | ~40–50 | ~3 | ~2.5 | 45–48% | ~2% | AWS + custom AI chips (Trainium/Inferentia) |
This chapter catalogs seven structural risks that threaten AI investors. First, AI Winter: the first (1974-1980) followed the Lighthill Report cutting UK funding, and the second (1987-1993) collapsed the expert-systems industry. Second, valuation bubble: the Nifty Fifty saw Polaroid fall 91% and McDonald's 64%, while today NVIDIA traded near 50x and Palantir above 100x earnings. Third, regulation: the EU's GDPR (2018) brought a €1.2 billion fine and became a global template, with the AI Act arriving in 2024. Fourth, geopolitics: TSMC makes roughly 90% of the most advanced chips, and the 2022 CHIPS Act allocated $52.7 billion to reshore production. Fifth, competition: SoftBank's Vision Fund and WeWork's $14 billion write-down show being right about AI doesn't make you right about a stock. Sixth, execution: IBM Watson failed in hospitals and was sold at a loss in 2022. Seventh, concentration. A risk-management matrix and rules follow. The takeaway: no single AI stock should exceed 5% of a portfolio.
| Risk Factor | Red Flag (Avoid/Reduce) | Yellow Flag (Monitor) | Green Flag (Acceptable) | How to Mitigate |
|---|---|---|---|---|
| AI Winter | Company priced on AI breakthroughs that don't exist yet | Revenue depends on AI adoption continuing at current pace | Revenue comes from proven AI products with real customers | Limit exposure to pre-revenue AI companies; favor profitable AI firms |
| Valuation | P/S > 20, no path to profitability, insider selling | P/S 10–20, founder still buying, improving margins | P/S < 10, positive FCF, reasonable growth assumptions | Use position sizing — no single AI stock > 5% of portfolio |
| Regulation | Business model depends on regulatory gray area | Compliance costs manageable, legal team in place | Actively working with regulators, diversified revenue | Own companies with strong compliance and government relations |
| Geopolitics | Entire supply chain through Taiwan or China | Multiple suppliers, some domestic production | Diversified supply chain, CHIPS Act beneficiary | Pair AI chip stocks with software AI stocks as a hedge |
| Competition | No moat, no data advantage, low switching costs | Some moat (integration, contracts), known competitors | Strong network effects, proprietary data, pricing power | Favor platforms over point solutions in AI |
| Execution | Product demos well but doesn't work in production | Product works but unit economics unproven | Proven product with expanding margins and retention | Read product reviews and customer interviews, not press releases |
| Concentration | Portfolio has 50%+ in AI stocks | Portfolio has 20–50% in AI stocks | Portfolio has 5–15% in AI stocks with broad diversification | Rebalance quarterly; set hard limits on single-sector exposure |
| Company | P/E (late 2024) | What It Priced In |
|---|---|---|
| NVIDIA | ~50 | 3–5 more years of hypergrowth |
| Microsoft | ~35 | AI adding 10%+ to revenue growth |
| CrowdStrike | ~80 | Dominance in AI-powered cybersecurity |
| Palantir | ~100+ | AI platform becoming a standard enterprise tool |
This chapter turns theory into buildable portfolios, grounded in Harry Markowitz's 1952 efficient frontier, the Core + Satellite framework, the Layered Approach, and local-plus-global diversification. It presents four models. The Conservative portfolio (VOO 40%, QQQ 20%, VRT 15%, EQIX 15%, cash 10%) targets 6-8% annualized. The Balanced portfolio (NVDA 15%, MSFT 15%, QQQ 20%, SMH 10%, VOO 15%, AVGO 10%, cash 15%) targets 9-12%. The Aggressive portfolio (NVDA 30%, TSM 15%, SMH 15%, AIQ 10%, VRT 10%, PLTR 10%, cash 10%) targets 12-20% with 40-60% drawdowns. The Stealth Wealth portfolio (VOO 25%, QQQ 20%, MSFT 15%, GOOGL 10%, EQIX 10%, BND 10%, GLD 5%, cash 5%) targets 7-10%. It then covers broker selection, account prioritization, DCA versus lump sum, rebalancing, tax considerations, and reflections from Markowitz, Ray Dalio, Cathie Wood, Peter Lynch, Charlie Munger, and Howard Marks. The takeaway: the best portfolio is the one you can hold through the inevitable ups and downs.
| Ticker | Name | Weight | Role |
|---|---|---|---|
| VOO | Vanguard S&P 500 ETF | 25% | Core equity — broad US market |
| QQQ | Invesco QQQ Trust | 20% | Growth/AI tilt — Nasdaq-100 |
| MSFT | Microsoft | 15% | Steady AI leader — enterprise moat, growing dividend |
| GOOGL | Alphabet (Google) | 10% | AI through DeepMind, Google Cloud, massive cash flow |
| EQIX | Equinix | 10% | Data center REIT — real assets, growing dividend |
| BND | Vanguard Total Bond Market ETF | 10% | Fixed income ballast — reduces portfolio volatility |
| GLD | SPDR Gold Trust | 5% | Inflation hedge, tail-risk hedge, uncorrelated asset |
| Cash | Money market or SGOV | 5% | Liquidity buffer |
| Ticker | Name | Weight | Role |
|---|---|---|---|
| NVDA | Nvidia | 15% | AI compute — the engine of the AI revolution |
| MSFT | Microsoft | 15% | Enterprise AI — Azure, Copilot, OpenAI partner |
| QQQ | Invesco QQQ Trust | 20% | Diversified AI/growth exposure |
| SMH | VanEck Semiconductor ETF | 10% | Semiconductor industry broad play |
| VOO | Vanguard S&P 500 ETF | 15% | Core US equity ballast |
| AVGO | Broadcom | 10% | AI networking and custom chips (ASICs) |
| Cash | Money market or SGOV | 15% | Liquidity and drawdown protection |
This chapter argues AI is reshaping every data-rich industry, so owning only big tech is a concentrated bet, not diversification. In healthcare, it highlights Eli Lilly (founded 1876, ~$800 billion market cap, AI-accelerated drug discovery), Alphabet's DeepMind (AlphaFold mapped over 200 million proteins), Amazon's health infrastructure, the pure-play Recursion, and Hims & Hers. In defense, it covers Palantir (~$4 billion run rate, ~55% government revenue), AeroVironment and its Switchblade drone used in Ukraine, Lockheed Martin, and Northrop Grumman. In fintech it examines SoFi, PayPal, Block, and Robinhood (Gold Card with 1M+ signups). It also surveys agriculture (Deere's autonomous tractors cutting herbicide use ~70%), education (Duolingo), energy (Constellation Energy, GE Vernova), and logistics (Symbotic). Sample sector portfolios and the investment philosophies of Philip Fisher, Cathie Wood, Sir John Templeton, and Peter Lynch close the chapter. The takeaway: diversify across sectors, and remember that even the best company is a bad investment if you overpay for it.
| Metric | Detail |
|---|---|
| Revenue (2026E) | ~$4B+ (transaction-based + subscription/Gold) |
| Funded Customers | ~25M+ |
| Gold Subscribers | ~3M+ (high-margin recurring revenue) |
| Assets Under Custody | ~$200B+ |
| AI Moat | Behavioral data — Robinhood knows how retail investors trade better than anyone |
| Key AI Product | Gold Card underwriting + AI-powered trade recommendations |
| Factor | Traditional Tech | Healthcare AI |
|---|---|---|
| Revenue model | Subscriptions, ads | Drug sales, licensing, cost savings |
| Regulation | Minimal | FDA, HIPAA — massive moats |
| Sales cycle | Weeks to months | Years — but contracts are sticky |
| Data moat | Moderate | Extreme — medical data is the most valuable data on earth |
| Market size | ~$5T (tech) | ~$12T (global healthcare spend) |
This chapter is a practical, step-by-step guide to buying AI stocks as a US retail investor. It compares brokerages — Fidelity, Charles Schwab, and Vanguard for free trades and fractional shares; Robinhood, M1 Finance, and SoFi Invest for mobile-first, automated investing; and Interactive Brokers for professional and international access. It lays out three purchase methods: buying individual stocks directly (with a table of tickers including NVDA, MSFT, AVGO, TSM as an ADR, VRT, and EQIX), buying ETFs (QQQ at 0.20%, SMH, AIQ), and buying fractional shares. A $10,000 scenario shows first-year costs are almost identical across brokerages, around $27 in ETF fees. It explains dollar-cost averaging, sets up automatic investing per broker, and covers tax-advantaged accounts — Roth IRA ($7,000 limit), 401(k) ($23,500), and the triple-tax-free HSA ($4,300). Five common mistakes and a four-week action plan follow. The takeaway: Fidelity for most people, M1 for automation, and never time the market.
| Company | Ticker | Type | Typical Price Range (2025) |
|---|---|---|---|
| NVIDIA | NVDA | US Common Stock | $100–$150 |
| Microsoft | MSFT | US Common Stock | $400–$500 |
| Broadcom | AVGO | US Common Stock | $200–$250 |
| AMD | AMD | US Common Stock | $100–$150 |
| Taiwan Semiconductor | TSM | ADR (NYSE) | $180–$220 |
| ASML Holding | ASML | ADR (Nasdaq) | $700–$900 |
| Vertiv Holdings | VRT | US Common Stock | $100–$140 |
| Equinix | EQIX | US Common Stock (REIT) | $900–$1,100 |
| Arista Networks | ANET | US Common Stock | $400–$500 |
| CrowdStrike | CRWD | US Common Stock | $350–$450 |
| Topic | Key Takeaway |
|---|---|
| Best brokerage for most people | Fidelity — free trades, fractional shares, automatic investing, excellent all-around |
| Best for set-and-forget DCA | M1 Finance — pies + auto-deposit = true automation |
| Cheapest index ETFs | VOO (0.03%), VGT (0.09%), QQQM (0.15%) |
| Best AI-specific ETF | SMH (0.35%) — concentrated semiconductor exposure |
| Cost comparison | All major US brokerages: ~$0 commissions, $27/year in ETF fees for a $10K portfolio |
| Fractional shares | Available at Fidelity, Schwab, Robinhood, M1 — buy $50 of NVIDIA |
| Best retirement account | Roth IRA — tax-free growth on AI stocks for decades |
| DCA strategy | Weekly automatic investing into QQQ + VOO + SMH — never time the market |
| Hidden superpower | HSA — triple tax-free, invest in AI stocks, pay healthcare in retirement tax-free |
| Biggest mistake | Trading too much — set DCA, check quarterly, ignore the noise |
The closing chapter distills the book into ten lessons, each tied to a major thinker. It opens by citing AI's adoption speed — from the telephone's 75 years to 100 million users down to ChatGPT's two months — and Peter Drucker's warning against yesterday's logic. David Swensen's advice frames layer selection by personality and time horizon. Peter Lynch's PEG ratio is called indispensable, noting NVIDIA traded at a 70+ P/E in 2023 when 100%+ earnings growth produced a PEG of 0.7. Buffett's pick-and-shovel principle points to NVIDIA, Vertiv, TSMC, and Equinix as the bottlenecks. Nassim Taleb anchors the risk discussion, and John Bogle makes the case for dollar-cost averaging over market timing. Harry Markowitz covers diversification, Charlie Munger a 30-minute weekly routine, and Philip Fisher's four sell signals close the practical lessons. Zuckerberg's "start before you're ready" ends the book. The takeaway: build a pick-and-shovel core, diversify, dollar-cost average, and act today rather than waiting.
1. AI Is the Biggest Megatrend of Our Era — Treat It That Way
Chart drawn from the table below, using the book’s own figures.
| Technology | Years to 100 Million Users |
|---|---|
| Telephone | 75 years |
| Radio | 38 years |
| Television | 13 years |
| Internet | 7 years |
| Smartphone | 5 years |
| ChatGPT | 2 months |
Available in Kindle, paperback and hardcover. A free review copy is available to readers who would like one.
Free review copies, all six books: books.bookfunnel.com/victor-wong-review-copies