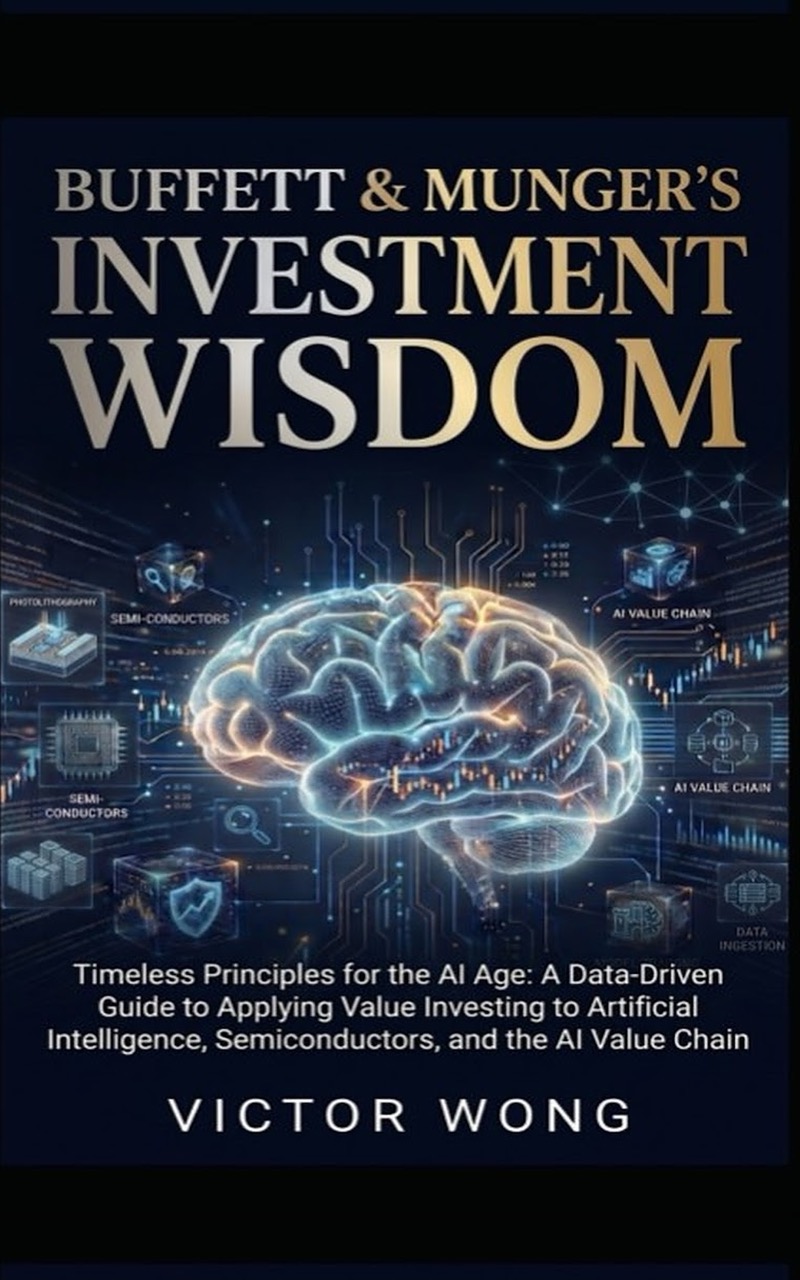
Timeless principles for the AI age
The moats that protect Nvidia, Microsoft and Alphabet; the margins that separate investment from mania; the circle that keeps you from betting what you don't understand. No tips, no schemes.
What each chapter argues, in order, with the figures it uses. From chapter 1 to the last page.
Part I — The Principles
The chapter opens with the Miracle of Omaha: between 1965 and 2025 Warren Buffett turned a failing textile mill into a company worth over $800 billion at roughly 19.9% annualized, nearly double the S&P 500's 10.4%, and $10,000 invested in Berkshire in 1965 grew to about $550 million against roughly $1.2 million in the index. It argues that what makes a business worth owning is an economic moat — a durable competitive advantage — and it lays out five types: cost advantage (GEICO), brand and intangibles (Coca-Cola), switching costs (Microsoft), network effects (American Express), and scale (Burlington Northern Santa Fe). Each type is illustrated with figures, from GEICO's fall from $61 in 1972 to $2 in 1976 and 40-fold recovery to Coca-Cola's $1.02 billion 1988 purchase worth about $26 billion by 2025 and Nvidia's 75% gross margin and 6 million CUDA developers. A section on fake moats uses AltaVista ($2.3 billion to $140 million), MySpace ($580 million to $35 million), IBM Watson Health (roughly $3 billion lost), and Builder.ai to show that first-mover status, claimed data advantages, and star talent are not moats. The reader's takeaway is that the direction of a moat matters more than its mere existence, and that a real moat never depends on any single person.
| Year | GEICO Stock Price | Event |
|---|---|---|
| 1948 | ~$27 | Benjamin Graham's partnership buys 50% of GEICO; stock goes public |
| 1951 | ~$20 | 21-year-old Buffett buys $10,000 worth (half his net worth) |
| 1972 | $61 | Peak of the bull market — the cost advantage was working perfectly |
| 1974 | $42 | First signs of trouble as rapid expansion strains reserves |
| 1975 | $7 | Losses mount; stock collapses as underwriting mistakes surface |
| 1976 (Spring) | $2 | Near bankruptcy. Stock loses 97% from its peak. Buffett begins buying heavily |
| 1977–1979 | ~$5–$10 | Turnaround management takes hold; Buffett increases his stake |
| 1980s | ~$20–$40 | Steady recovery as the cost-advantage model proves resilient |
| 1995 | ~$80 | Berkshire buys remaining 49% for $2.3 billion — a 40x return from the 1976 low |
| 1996 | N/A (taken private) | GEICO becomes a wholly owned Berkshire subsidiary |
| Company | Cost Advantage | Brand / Intangibles | Switching Costs | Network Effects | Scale / Efficiency | Overall Moat |
|---|---|---|---|---|---|---|
| Nvidia | Strong (CUDA cost lock-in) | Strong (recognized AI leader) | Very Strong (CUDA ecosystem) | Moderate (developer ecosystem growing) | Strong (fabless model, TSMC partnership) | Wide |
| Microsoft | Strong (hyperscaler economics) | Very Strong (enterprise trust) | Very Strong (Office / Azure lock-in) | Growing (OpenAI ecosystem) | Very Strong (global cloud infra) | Wide |
| Alphabet (Google) | Strong (hyperscaler economics) | Very Strong (search dominance) | Moderate (search is low-switch) | Very Strong (search flywheel) | Very Strong (global cloud infra) | Wide |
| Meta | Moderate | Strong (social platforms) | Moderate (users can leave) | Very Strong (3B+ users) | Strong | Narrow to Wide |
| Apple | Moderate (premium pricing) | Very Strong (brand loyalty) | Strong (ecosystem lock-in) | Strong (App Store effect) | Strong (supply chain scale) | Wide |
| Amazon (AWS) | Very Strong (scale economics) | Strong (enterprise trust) | Strong (AWS + data lock-in) | Moderate (AWS marketplace) | Very Strong (global infra) | Wide |
| AMD | Moderate | Weak (commodity brand) | Weak (no CUDA equivalent) | Weak | Moderate | Narrow |
| Palantir | Weak | Moderate (gov contracts) | Strong (integration lock-in) | Weak | Moderate | Narrow |
| C3.ai | Weak | Weak | Weak | Weak | Weak | No Moat |
| SoundHound | Weak | Weak | Weak | Weak | Weak | No Moat |
This chapter explains the margin of safety — Benjamin Graham's principle of never paying more for a stock than it is worth — and traces how Buffett refined it from buying anything cheap into buying a wonderful business at a fair price. The Washington Post anchors the argument: in 1973 Buffett valued the company at roughly $400 to $500 million while the market priced it near $100 million, invested $10.6 million, and by 2025 held a stake worth over $1 billion, about 100 times his cost. American Express after the 1963 salad-oil scandal shows buying in panic — the stock fell from $65 to $35 and Buffett put 40% of his partnership into it — while Coca-Cola (1988, $1.02 billion to $26 billion) and Burlington Northern (2010, $34 billion at 13.6 times earnings) show margins built on future earnings power and irreplaceable assets. The chapter argues AI stocks need a larger margin of safety because their earnings are unpredictable, their technology changes fast, and valuations run at 50 to 100 times earnings. Worked examples give Microsoft a negative margin near 30% and Palantir near negative 94% at 320 times earnings. The reader takes away a three-step framework: estimate a predictable earnings ceiling, apply a conservative multiple, and compare against the S&P 500 or T-bills.
| Company | 2025 EPS | 2025 Stock Price | P/E Ratio | Growth Rate (5yr) | Estimated Intrinsic Value | Margin of Safety | Verdict |
|---|---|---|---|---|---|---|---|
| Microsoft | ~$15.00 | ~$450 | 30x | ~15% | ~$500–600 | 10–25% | Narrow — fair price for quality |
| Alphabet | ~$8.50 | ~$200 | 24x | ~12% | ~$250–300 | 20–35% | Moderate — undervalued relative to peers |
| Meta | ~$25.00 | ~$600 | 24x | ~15% | ~$700–800 | 15–25% | Moderate — reasonable entry |
| Apple | ~$7.50 | ~$240 | 32x | ~8% | ~$250–300 | 5–20% | Narrow — excellent business, high price |
| Nvidia | ~$4.50 | ~$140 | 31x | ~30%+ | Highly uncertain | Unknown | Requires high growth to justify valuation |
| AMD | ~$3.00 | ~$120 | 40x | ~20% | Highly uncertain | Minimal | Premium pricing for uncertain future |
| Palantir | ~$0.25 | ~$80 | 320x | ~25% | Very uncertain | None | No margin of safety |
| C3.ai | Negative | ~$30 | N/A | N/A | N/A | None | No earnings to value |
| SoundHound | Negative | ~$12 | N/A | N/A | N/A | None | No earnings to value |
| Alternative | Expected Return (est.) | Risk Level | The Comparison |
|---|---|---|---|
| S&P 500 index fund | ~8–10% | Moderate | The default you must beat |
| 3-month T-bills | ~4–5% | Minimal | Buffett's current cash parking spot |
| Microsoft (30x earnings) | ~10–12% | Low | Beats the index, barely |
| Alphabet (24x earnings) | ~12–14% | Low-moderate | Beats the index with room to spare |
| Nvidia (31x earnings) | ~12–15% if growth holds | High | Beats the index only if the AI capex cycle continues |
| Palantir (320x earnings) | Unknown | Very high | Cannot beat the index with confidence |
The chapter argues that the circle of competence — knowing what you actually understand and, more importantly, its boundaries — is the discipline that makes the moat and margin-of-safety principles work. It traces how Buffett built his circle over 70 years, from 1950s net-net bargains to See's Candy in 1972, and shows that he bought no major technology stock until IBM in 2011, at roughly $170 per share, then sold 94.5% of the position in 2017 as IBM's revenue fell from $107 billion to $79 billion. Every significant mistake is framed as a circle violation: Dexter Shoes (1993), paid for with Berkshire stock later worth about $3.5 billion, US Airways (1989), and IBM's roughly $8 billion opportunity cost against Apple. Apple is the counterexample — bought from 2016 at about $30 per share, it became the greatest investment of his life with over $120 billion in profit, because Buffett recognized it as a consumer brand he understood. A two-investor comparison shows one who studied Nvidia turning $10,000 into about $295,000 and one who chased hype AI stocks losing most of it. The takeaway is a three-question test and the habit of expanding the circle only through deliberate, boring study.
| Year | IBM Revenue | IBM Net Income | EPS (Diluted) | IBM Stock Price (Year-End) | S&P 500 Index |
|---|---|---|---|---|---|
| 2011 | $106.9 B | $15.9 B | $13.25 | ~$184 | 1,257 |
| 2012 | $102.9 B | $16.6 B | $14.37 | ~$196 | 1,426 |
| 2013 | $98.4 B | $16.5 B | $14.94 | ~$185 | 1,848 |
| 2014 | $92.8 B | $12.0 B | $11.90 | ~$154 | 2,059 |
| 2015 | $81.7 B | $13.2 B | $13.42 | ~$134 | 2,044 |
| 2016 | $79.9 B | $11.9 B | $12.38 | ~$166 | 2,239 |
| 2017 | $79.1 B | $5.8 B | $6.14 | ~$153 | 2,674 |
| Buffett sold 94.5% of his IBM stake in 2017 | |||||
| Change | −26% | −64% | −54% | −17% | +113% |
| Era | What Was Inside the Circle | What Was Outside | Signature Win / Painful Miss |
|---|---|---|---|
| 1950s | Net-net bargains, small manufacturing | Growth stocks, brand businesses | Dempster Mill ✅ / Fairchild Semiconductor ❌ |
| 1960s | Insurance, textile turnarounds | Conglomerates, technology | National Indemnity ✅ |
| 1970s | Consumer brands, insurance float | Oil, airlines, tech | See's Candy ✅ |
| 1980s | Global consumer franchises, media | Banks, complex financials | Coca-Cola ✅ / Missed Microsoft IPO ❌ |
| 1990s | Financials, consumer with global scale | Dot-com stocks, telecom | GEICO full purchase ✅ / Passed Amazon ❌ |
| 2000s | Large-cap industrials, energy | Subprime mortgages, crypto | Burlington Northern ✅ |
| 2010s | Tech as consumer products | AI hype, most tech IPOs | Apple ✅ / IBM ❌ |
| 2020s | Japan trading houses, energy infrastructure | Most AI stocks, crypto, SPACs | Japanese 5 trading houses ✅ |
Part II — The Case Studies
This chapter examines Buffett's largest stock purchase, Apple in 2016, when he was 86 and had spent fifty years passing on technology companies. Berkshire invested roughly $35 billion at an average of about $30 per share (split-adjusted), and by its peak the position was worth about $160 billion, generating over $120 billion in profit on a single stock. Buffett's reasoning is the point: he saw not a technology company but a consumer brand with a technology moat, the same brand loyalty and switching costs he had already studied in Coca-Cola, See's Candy, and American Express. The chapter details three moats — ecosystem lock-in with a customer retention rate above 90% and about 2.35 billion active devices by 2025, a brand premium with an iPhone average selling price near $900 against roughly $250 for Android phones, and a services flywheel that grew from $24 billion to about $100 billion. Apple's gross margin expanded from 39% to 46% over the decade. A closing contrast with IBM, which returned essentially nothing, argues that a moat inside your circle lets you see whether it is widening or narrowing. The reader takes away the lesson that the install base and recurring revenue, not the technology, are the moat.
| Metric | Apple (2016) | Apple (2025) | Change |
|---|---|---|---|
| Revenue | $215.6 B | $416.2 B | 1.9x |
| Net Income | $45.7 B | $112 B | ~2.45x |
| iPhone Revenue | $136.7 B | ~$209 B | ~1.5x |
| Services Revenue | $24.3 B | ~$100 B | ~4.1x |
| Active Devices (installed base) | ~1.0 B | ~2.3 B | 2.3x |
| Gross Margin | 39% | 46% | +7 pts |
| Stock Price (split-adj.) | ~$30 | ~$245 | ~8.2x |
| Market Capitalization | ~$600 B | ~$4.0 T | ~6.7x |
Moat #3: The Services Flywheel
Chart drawn from the table below, using the book’s own figures.
| Services Line | 2024 Revenue | The Moat It Builds |
|---|---|---|
| App Store | $31.7 B | 850M weekly users; developers earned $550B since 2008 |
| Licensing (Google search deal) | $17.4 B | Google pays billions to be the default search on Safari |
| AppleCare + Other | $12.5 B | Service revenue with high margins |
| Third-party subscriptions | $11.9 B | Apple takes a cut of Netflix, Spotify, etc. |
| iCloud | $10.4 B | The photo/data lock-in that raises switch costs |
| Apple Music | $8.9 B | 100M+ subscribers, #1 streaming growth |
| Apple TV+ | $3.4 B | Small today, growing engagement +36% |
Using the gold-rush framing that the pick-and-shovel sellers profit most, this chapter maps the AI value chain into four layers and asks where the profit actually flows. Layer one, chips and hardware, is dominated by Nvidia, with $115.2 billion in 2025 data center revenue, a roughly 75% gross margin, and about 90% of the AI training market, though the semiconductor cycle cut its stock over 60% in 2022. Layer two, cloud and infrastructure, is the toll road: AWS (29% share), Azure (20%), and Google Cloud (13%) control 62% of the market, and the chapter calls this the safest AI investment because of scale, switching costs, and enterprise trust. Layer three, models, includes OpenAI growing from about $2 billion to $20 billion and Anthropic from $87 million to $9 billion, but the chapter calls it the danger zone because of price wars, open-source rivals, and easy customer switching. Layer four, applications, is where history says fortunes land, with Microsoft's Copilot reaching 1.4 billion Office users and Palantir growing revenue 137% year-over-year in commercial. The reader's takeaway is a profit map ranking each layer by moat strength and predictability, and an exercise to map their own circle across the four layers.
| Layer | What It Does | Who Sells It | Example Companies |
|---|---|---|---|
| 1. Chips & Hardware | The physical engines that train and run AI models | Semiconductor designers and foundries | Nvidia, AMD, TSMC, Broadcom |
| 2. Cloud & Infrastructure | The data centers, networks, and platforms that deliver AI computing | Hyperscalers | Amazon (AWS), Microsoft (Azure), Google (Cloud) |
| 3. Models & Foundation AI | The AI itself — the "brains" that understand language, images, and code | Model developers | OpenAI, Anthropic, Google Gemini, Meta |
| 4. Applications | The software that uses AI to solve real problems for businesses and consumers | Software companies | Microsoft (Copilot), Palantir, Salesforce |
| Company | 2024 Data Center Revenue | 2025 Data Center Revenue | Gross Margin | Market Position |
|---|---|---|---|---|
| Nvidia | $47.5 B | $115.2 B | ~75% | ~90% of AI training market |
| AMD | ~$5.5 B | ~$10 B | ~51% | Distant #2, trying to break in |
| Broadcom | ~$12 B | ~$20 B | ~65% | Custom AI chips for Google/Meta |
| Intel | ~$4 B | ~$6 B | ~35% | Losing share in data center |
This chapter traces how Nvidia built what it calls the most carefully constructed economic moat of the modern era. Founded at a Denny's in 1993 with $40,000, Nvidia nearly died with the NV1 chip, then launched CUDA in 2006 — a bet that cut its market value from about $8 billion to $1.5 billion before paying off when AlexNet was trained on GeForce cards in 2012. The company became the first to reach a $4 trillion market value in July 2025 and crossed $5 trillion by 2026. The chapter dissects a compound moat of four parts: the CUDA software ecosystem with 6 million developers, a hardware lead funded by over $10 billion in annual R&D, full-stack integration after the $6.9 billion Mellanox acquisition, and data center lock-in. The financials show revenue rising from $27 billion in 2023 to $130.5 billion in 2025 and net income growing 16.5 times. The 2022 crash, in which the stock fell 66%, is framed as a test where the moat stayed intact and the price finally offered a margin of safety. The chapter closes with Munger's inversion: hyperscalers building their own chips, an AI capex downturn, and a technology breakthrough as the three real risks. The reader learns that Nvidia demands understanding of the cycle and sits at the edge of most investors' circles.
| Year | Nvidia Milestone | Market Context |
|---|---|---|
| 1993 | Founded at Denny's with $40,000 | PC graphics race begins |
| 1995 | NV1 fails — company nearly dies | 3Dfx dominates |
| 1997 | RIVA 128 saves the company | 1M units in 4 months |
| 1999 | IPO at ~$600M market cap | PC gaming boom |
| 2006 | CUDA launched — nearly kills the company | Market cap falls $8B → $1.5B |
| 2012 | AlexNet trained on Nvidia GPUs — AI revolution begins | Deep learning era starts |
| 2016 | DGX-1 supercomputer delivered to OpenAI | Jensen delivers personally |
| 2020 | Mellanox acquisition ($6.9B) — network moat built | Data center push |
| 2022 | Stock crashes 66% — crypto bust, rate hikes | Worst year since 2008 |
| 2023 | ChatGPT era — stock +239% | First $1T company |
| 2024 | Data center revenue hits $47.5B; stock +171% | AI capex supercycle |
| 2025 | Revenue $130.5B, gross margin 75% | First $4T company (July 2025) |
| 2026 | Crossed $5 trillion | Unprecedented |
| Year | Revenue | Data Center Revenue | Data Center % of Revenue | Gross Margin | Net Income |
|---|---|---|---|---|---|
| 2019 | $11.7 B | $2.9 B | ~25% | 61% | $2.8 B |
| 2020 | $10.9 B | $5.0 B | ~46% | 62% | $4.3 B |
| 2021 | $16.7 B | $8.1 B | ~49% | 63% | $9.8 B |
| 2022 | $26.9 B | $10.6 B | ~40% | 65% | $9.8 B |
| 2023 | $27.0 B | $15.0 B | ~56% | 57% | $4.4 B |
| 2024 | $60.9 B | $47.5 B | ~78% | 73% | $29.8 B |
| 2025 | $130.5 B | $115.2 B | ~88% | 75% | $72.9 B |
This chapter runs the seven stocks that dominate the American market — Alphabet, Amazon, Apple, Meta, Microsoft, Nvidia, and Tesla, a term coined by Bank of America strategist Michael Hartnett in 2023 — through the book's three tests. As of mid-2026 the group was worth roughly $23 trillion, about one-third of the S&P 500's value, and drove more than 40% of its 2025 return. The moat test finds six of seven deepening and Tesla's most uncertain; the margin-of-safety test finds five trading at thin but present margins while Nvidia and Tesla demand near-perfection; the circle test finds five easy to explain and the chip and automaker businesses harder. The chapter then recounts what Buffett actually did: he owns Apple, trimming it as the position exceeded 50% of the portfolio, and in 2025 first bought Alphabet, following with larger 2026 additions that made it a top-five holding after decades of calling Google a missed opportunity. He passed on Microsoft, Amazon (“I was too dumb”), Nvidia, and Tesla — Munger called Tesla's valuation “insane” in 2022. The reader takes away that Buffett was often wrong about which circle to expand into but never wrong about the discipline of staying inside it, and that concentration, not the business, was the real risk.
| Company | Market Cap (May 2026) | 5-Year Return | 10-Year Return |
|---|---|---|---|
| Nvidia | ~$5.05 T | +1,369% | +24,345% |
| Alphabet | ~$4.79 T | +208% | +787% |
| Apple | ~$4.22 T | +127% | +1,034% |
| Microsoft | ~$3.08 T | +75% | +669% |
| Amazon | ~$2.96 T | +38% | +659% |
| Meta | ~$1.56 T | +157% | +505% |
| Tesla | ~$1.50 T | +84% | +3,239% |
| Company | Primary Moat | Moat Direction | Strength |
|---|---|---|---|
| Microsoft | Office + Azure switching costs, enterprise trust | Deepening (AI makes Office stickier) | Very strong |
| Alphabet | Search data flywheel + distribution | Deepening (but AI search is a new risk) | Strong |
| Apple | Ecosystem lock-in, brand, services | Deepening (2.3B devices) | Very strong |
| Meta | 3B-user network effects | Deepening (AI improves ads) | Strong |
| Amazon | Scale logistics + AWS oligopoly | Deepening | Very strong |
| Nvidia | CUDA ecosystem + hardware lead | Deepening (but customers building own chips) | Strong, with a real threat |
| Tesla | Brand + data from real-world driving | Uncertain — EV competition intensifying | Narrow |
Part III — The Playbook
This chapter explains why Buffett holds only 10 to 25 stocks at a time, with his top five typically 60 to 70% of the portfolio, and applies that concentration logic to building an AI portfolio. It lays out Berkshire's roughly 30 public holdings in a ranked table where the top 20 make up about 98% of value, and the four Buffett-Munger rules: own only what you understand, own only businesses with wide deepening moats, buy only with a margin of safety, and let winners grow. A four-step framework follows — define your circle across the AI value chain, rank companies by moat strength, size positions by conviction, and add an index-fund hedge. Position-sizing bands run from 15 to 20% for maximum conviction to zero for anything you cannot explain, and the chapter cites the SPIVA study showing roughly 90% of large-cap fund managers underperformed the S&P 500 over 15 years. It presents three sample portfolios (Conservative, Balanced, and Aggressive) as illustrations rather than recommendations. The reader takes away that the cloud and application layers hold the most understandable AI businesses, that a low-cost index fund protects against your own mistakes, and that a written one-paragraph thesis per stock is a contract with yourself.
| # | Company | Portfolio % | Approx. Original Cost | Current Price (2026) | The Story |
|---|---|---|---|---|---|
| 1 | Apple (AAPL) | ~23% | ~$36 B | ~$309 | Bought 2016; peaked near $160B; now trimmed to $58B |
| 2 | American Express (AXP) | ~17% | ~$1.3 B | ~$340 | Common stock held since 1994; pays ~$479M/yr dividends |
| 3 | Coca-Cola (KO) | ~12% | ~$1.0 B | ~$88 | Never sold a share since 1988; ~$816M/yr dividends |
| 4 | Bank of America (BAC) | ~11% | ~$14.6 B | ~$62 | Built 2011–2017 via preferred-stock conversion |
| 5 | Alphabet (GOOGL) | ~6% | ~$3 B | ~$342 | New in 2025 — Buffett finally bought Google |
| 6 | Chevron (CVX) | ~5% | ~$19 B | ~$195 | Energy bet built 2020–2023 |
| 7 | Occidental (OXY) | ~5% | ~$12 B | ~$55 | Aggressive 2022–2024 build with warrants |
| 8 | Chubb (CB) | ~4% | ~$6.7 B | ~$351 | Insurance giant bought 2023 |
| 9 | Moody's (MCO) | ~4% | ~$2.2 B | ~$486 | Held since 2000; rating-agency toll road |
| 10 | Kraft Heinz (KHC) | ~3% | ~$9.8 B | ~$26 | 2015 merger with 3G; still held despite losses |
| 11 | DaVita (DVA) | ~2% | ~$1.4 B | ~$238 | Dialysis operator held since 2011 |
| 12 | Sirius XM (SIRI) | ~1% | ~$1.5 B | ~$31 | Media bet built 2024 |
| 13 | Delta Air (DAL) | ~1% | ~$0.5 B | ~$89 | New in 2026 — airlines are back in the circle |
| 14 | Kroger (KR) | ~1% | ~$2.5 B | ~$58 | Grocery staple held since 2019 |
| 15 | VeriSign (VRSN) | ~1% | ~$0.7 B | ~$287 | Domain registry toll road; high margins |
| 16 | Capital One (COF) | ~0.5% | ~$2 B | ~$210 | Financial bet built 2024 |
| 17 | Ally Financial (ALLY) | ~0.4% | ~$1 B | ~$43 | Auto-finance bet |
| 18 | New York Times (NYT) | ~0.4% | ~$0.07 B | ~$76 | Small media holding since 2022 |
| 19 | Nucor (NUE) | ~0.3% | ~$0.9 B | ~$260 | Steelmaker bought 2025 |
| 20 | Lennar (LEN) | ~0.3% | ~$0.7 B | ~$84 | Homebuilder bought 2025 |
| Top 20 Total | ~98% | ~$118 B | — | The entire portfolio in 20 stocks |
Portfolio B: The Balanced (The Buffett-Munger Blend)
Chart drawn from the table below, using the book’s own figures.
| Position | Weight | Rationale |
|---|---|---|
| S&P 500 Index Fund | 25% | Diversification floor |
| Microsoft | 15% | AI moat + enterprise lock-in |
| Alphabet | 15% | AI search + cloud + Gemini |
| Apple | 10% | Ecosystem moat + services growth |
| Amazon | 10% | AWS toll road + retail scale |
| Meta | 10% | Network effects + AI ad targeting |
| Berkshire Hathaway | 10% | The original compounder |
| Cash | 5% | Dry powder |
| Total | 100% |
The chapter argues that AI investing is a test of psychology rather than intelligence, and it applies Munger's catalog of cognitive biases to AI stocks. It begins with the behavior gap: DALBAR's 20-year study found the average equity fund investor earned roughly 4.7% a year while the S&P 500 returned about 8.2%, a 3.5-point gap caused entirely by bad timing, and a retail survey found 42% of investors lost money to emotional trading. It then walks through the biases — recency, social proof, commitment, inversion, and anchoring — each with a Munger antidote and a practical test. Recency is answered by studying past manias from railroads to crypto; social proof by treating consensus as a warning; commitment by writing the bear case before buying; inversion by asking what would guarantee a loss; and anchoring by valuing the business on its own terms. The anchoring section uses Cisco, whose stock fell 89% from its $80 peak in 2000 to $8 in 2002 and did not close above $80 again until December 2025. The reader takes away a six-item bias checklist to run before every purchase and the rule that the biases never change, only the story does.
| Past Mania | The Story Investors Told | The Outcome |
|---|---|---|
| Railroads (1850s) | "The railway is a sure thing" | 60% of railroads went bankrupt |
| Automobiles (1920s) | "Everyone will own a car" | Over 2,000 companies were formed; the industry consolidated to the Big Three |
| Radio (1920s) | "Radio will change everything" | The bubble burst within 2 years |
| Internet (2000) | "Earnings don't matter — it's a new economy" | NASDAQ fell 78% |
| Crypto (2021) | "Digital gold" | 90%+ of coins went to zero |
| AI (2024–2026) | "This time it's different" | ? |
| 20-Year Average | Annualized Return | The Cost of Behavior |
|---|---|---|
| S&P 500 (buy and hold) | ~8.2% | — |
| Average equity fund investor | ~4.7% | −3.5% per year from bad timing |
| $10,000 invested (market) | ~$48,000 | — |
| $10,000 invested (average investor) | ~$25,000 | Half the money, lost to behavior |
The final chapter returns to the book's central number — 19.9% compounded over 60 years, which turned $10,000 into roughly $550 million — and argues that compounding rewards time and temperament more than brilliance. A compounding table shows $10,000 becoming $114,674 at 5% over 50 years but $91 million at 20%. It then distills seven lessons from the Miracle of Omaha: the moat always comes first; price matters but less than the moat; the best investment is boring; sell only when the thesis breaks, never because the price fell; keep dry powder, with Berkshire holding over $300 billion in cash in 2025; time in the market beats timing it, illustrated by the J.P. Morgan finding that missing the best days halves the return; and the willingness to be wrong without being destroyed. Each lesson is anchored in real holdings and figures, from See's Candy to IBM's eroded moat. The chapter ends with a seven-article Investment Contract the reader is asked to write, covering circle, moat test, margin of safety, position sizes, holding period, bias checklist, and the promise to re-read the book in both panic and euphoria. The technology will change; the principles will not.
| Buffett Principle | Chapter | How It Applies to AI |
|---|---|---|
| Economic Moat | Chapter 1 | Only invest in AI companies with wide, deepening moats |
| Margin of Safety | Chapter 2 | Only buy when the price gives you room for error |
| Circle of Competence | Chapter 3 | Only invest in AI companies you can explain in one sentence |
| Mental Models & Bias Checklist | Chapter 9 | Use inversion and the checklist to avoid the mania's traps |
| Patience | Chapter 10 | Hold through the cycles — the 2022 crash proved AI survives |
| Compounding | Chapter 10 | The most powerful force — and it only works with time |
| Temperament | Chapter 10 | The ability to sit still when the market screams |
| Years | 5% Return | 10% Return | 15% Return | 20% Return |
|---|---|---|---|---|
| 10 | $16,289 | $25,937 | $40,456 | $61,917 |
| 20 | $26,533 | $67,275 | $163,665 | $383,376 |
| 30 | $43,219 | $174,494 | $662,118 | $2,373,763 |
| 40 | $70,400 | $452,593 | $2,678,635 | $14,697,716 |
| 50 | $114,674 | $1,173,909 | $10,837,057 | $91,004,382 |
Available in Kindle, paperback and hardcover. A free review copy is available to readers who would like one.
Free review copies, all six books: books.bookfunnel.com/victor-wong-review-copies